Journal of Cancer
ISSN: 1837-9664
3.2
Impact Factor
ISSN: 1837-9664

 Global reach, higher impact
J Cancer 2016; 7(14):2157-2164. doi:10.7150/jca.16476 This issue Cite
Research Paper
The Impact of Clinical Stage on Radiation Doses to Organs at Risk Following Intensity-modulated Radiotherapy in Nasopharyngeal Carcinoma: A Prospective Analysis
Lin Xu1,2*, Ji-Jin Yao1,3*, Guan-Qun Zhou1, Wang-Jian Zhang4, Guo-Long Liu2, Li-Zhi Liu5, Jun Ma1, Ying Sun1 ![]()
1. Department of Radiation Oncology, Sun Yat-sen University Cancer Center, State Key Laboratory of Oncology in South China, Collaborative Innovation Center for Cancer Medicine, Guangzhou 510060, Guangdong Province, People's Republic of China;
2. Department of Oncology, Guangzhou First People's Hospital, Guangzhou Medical University, 1 Panfu Road, Guangzhou 510180, Guangdong Province, People's Republic of China;
3. Department of Radiation Oncology, the Fifth Affiliated Hospital of Sun Yat-sen University, Zhuhai 519001, Guangdong Province, China;
4. Department of Medical Statistics and Epidemiology & Health Information Research Center & Guangdong Key Laboratory of Medicine, School of Public Health, Sun Yat-sen University, Guangzhou 510080, Guangdong Province, China;
5. State Key Laboratory of Oncology in South China, Collaborative Innovation Center for Cancer Medicine, Imaging Diagnosis and Interventional Center, Sun Yat-sen University Cancer Center, Guangzhou 510060, People's Republic of China.
*These authors contributed equally to this paper.
Received 2016-6-14; Accepted 2016-8-14; Published 2016-10-25
Citation:
Xu L, Yao JJ, Zhou GQ, Zhang WJ, Liu GL, Liu LZ, Ma J, Sun Y. The Impact of Clinical Stage on Radiation Doses to Organs at Risk Following Intensity-modulated Radiotherapy in Nasopharyngeal Carcinoma: A Prospective Analysis. J Cancer 2016; 7(14):2157-2164. doi:10.7150/jca.16476. https://www.jcancer.org/v07p2157.htm
Other stylesAbstract
Background: The development of intensity-modulated radiotherapy (IMRT) has revolutionized the management of nasopharyngeal carcinoma (NPC). The purpose of this study was to investigate the impact of clinical stage on radiation doses to organs at risk (OARs) in NPC.
Material and Methods: One hundred and forty-eight patients with newly diagnosed and untreated NPC were prospectively enrolled. Based on the anatomic definition and pathogenesis of radiation induced injury, a total of 28 OARs surrounding the nasopharynx were contoured on axial computed tomography (CT) planning images in each patient. Dose-volume histograms, as well as the mean and maximal doses for each structure, were calculated.
Results: Radiation doses to 15 OARs (including the brain stem, temporal lobe and eye) were positively correlated with T stage, the radiation doses to 13 OARs (including the brachial plexus, parotid and thyroid) increased significantly with N stage, and the radiation doses to the spinal cord and mandible had no association with T or N stage. Based on the characteristic of excess rates, 9 OARs (e.g. spinal cord, eye, trachea, and et al.) met tolerance doses easily in all stages, 9 OARs (e.g. brain stem, temporal lobe, brachial plexus, and et al.) easily in early stages but with difficulty in advanced stages, and 10 OARs (e.g. cochlea, parotid, thyroid, and et al.) with difficulty in all stages.
Conclusions: The radiation doses to most of OARs are associated with T or N stage, and there are three kinds of patterns for them: 1) meet tolerance doses easily in all stages; 2) meet tolerance doses easily in early stages but with difficulty in advanced stages; and 3) meet tolerance doses with difficulty in all stages.
Keywords: Nasopharyngeal carcinoma, Organs at risk, Radiation doses, Excess rate, Clinical stage.
Introduction
Nasopharyngeal carcinoma (NPC) is endemic in particular regions such as Southeast Asia, and the annual incidence varies from 30 to 80 per 100,000 people in South China [1-2]. Radiotherapy is the preferred therapeutic modality for non-metastatic NPC.
Although intensity-modulated radiotherapy (IMRT) provides excellent loco-regional control and sparing of organs at risk (OARs) in NPC [3-5], late toxicities such as grade 2 to 4 xerostomia and sensorineural hearing loss still occur with incidences of 39.3% and 37.0%, respectively [5-6]. Thus, improvements in OARs sparing and reduction in radiation toxicity remain important issues. Given the lack of studies, the characteristic of dosimetry distribution for OARs surrounding nasopharynx remains unclear.
On the basis of this premise, we prospectively enrolled 148 NPC patients and investigated the link between radiation doses to the OARs and clinical stages (T&N stage) in order to further reduce subsequent complications by improving the efficiency of plan optimization and evaluation.
Materials and Methods
Study population
From July 2013 to October 2014, a total of 148 patients with newly diagnosed, biopsy-proven non-metastatic NPC who presented to our center were prospectively enrolled in the study. This group was composed of 107 male and 41 female patients, and the median age was 42 years (range, 27-76 years). Forty-eight patients (32.4%) had T1/T2 disease and 100/146 (67.6%) had T3/T4 disease. Eighty-five patients (57.5%) had N0/N1 disease and 63/148 (42.5%) had N2/N3 disease. Twenty-three patients (15.5%) were diagnosed with stage I or II NPC and 125/146 (84.5%) were diagnosed with stage III or IV NPC (Table 1). The study was approved by the Institutional Review Board of Sun Yat-sen University Cancer Center. Informed consent was obtained from all individual participants included in the study.
Radiotherapy techniques
All of the patients received definitive external irradiation. Target volumes were delineated using our institutional treatment protocol [7], in accordance with the International Commission on Radiation Units and Measurements reports 50 and 62 [8-9]. Magnetic resonance imaging (MRI) was used to help define the parapharyngeal and superior extent of the tumor. The prescribed dose was 70 Gy to the planning target volume (PTV) of the gross tumor volume (GTVp), 64-66 Gy to the PTV of the nodal gross tumor volume (GTVn), 60 Gy to the PTV of the clinical target volume-1 (CTVp1; high risk regions), and 54 Gy to the PTV of the CTVp2 (low-risk regions) and the CTVn (nodal regions in the neck) in 33 fractions. The PTVs of GTVp, CTVp1, and CTVp2 were named PTV_7000, PTV_6000, and PTV_5400, respectively. All patients were treated with one fraction daily, 5 days a week.
Table 1
Characteristics of the 148 nasopharyngeal carcinoma patients.
| Characteristics | No. of patients (%) |
|---|---|
| Age (years) | |
| Median | 42 years |
| Range | 27-76 years |
| Sex | |
| Male | 107 (72.3) |
| Female | 41 (27.7) |
| Histology | |
| WHO I | 1 (0.7) |
| WHO II/III | 147 (99.3) |
| T category | |
| T1 | 16 (10.8) |
| T2 | 32 (21.6) |
| T3 | 69 (46.6) |
| T4 | 31 (20.9) |
| N category | |
| N0 | 18 (12.2) |
| N1 | 67 (45.3) |
| N2 | 37 (25.0) |
| N3 | 26 (17.6) |
| Clinical stage | |
| I | 4 (2.7) |
| II | 19 (12.8) |
| III | 70 (47.3) |
| IV | 55 (37.2) |
| Chemotherapy | |
| No | 7 (4.7) |
| Yes | 141 (95.3) |
Delineation of OARs
For the anatomic site specificity of NPC, the radiation field of traditional radiotherapy usually involved many normal tissues. In the present study, a total of 28 OARs surrounding the nasopharynx were analyzed, including the brain stem, optic nerve, spinal cord, temporal lobe, chiasm, pituitary, parotid, mandible, lens, eye, temporomandibular (TM) joint, oral cavity, cochlea, internal auditory canal (IAC), vestibule and semicircular canal (VestibulSemi), Eustachian tube, thyroid, trachea, esophagus, larynx, pharynx, brachial plexus, and et al. Based on the anatomic definition and pathogenesis of radiation induced injury, an experienced radiation oncologist manually contoured OARs on the planning CT scans of the 148 patients with a reasonable contouring method (Fig. 1) [10]. Critical organs, such as the brain stem and spinal cord, plus 3 mm margins were used to generate the planning organ-at-risk volume (PRV), and denoted as “BrainStem_PRV” and “SpinalCord_PRV”, respectively.
Figure 1
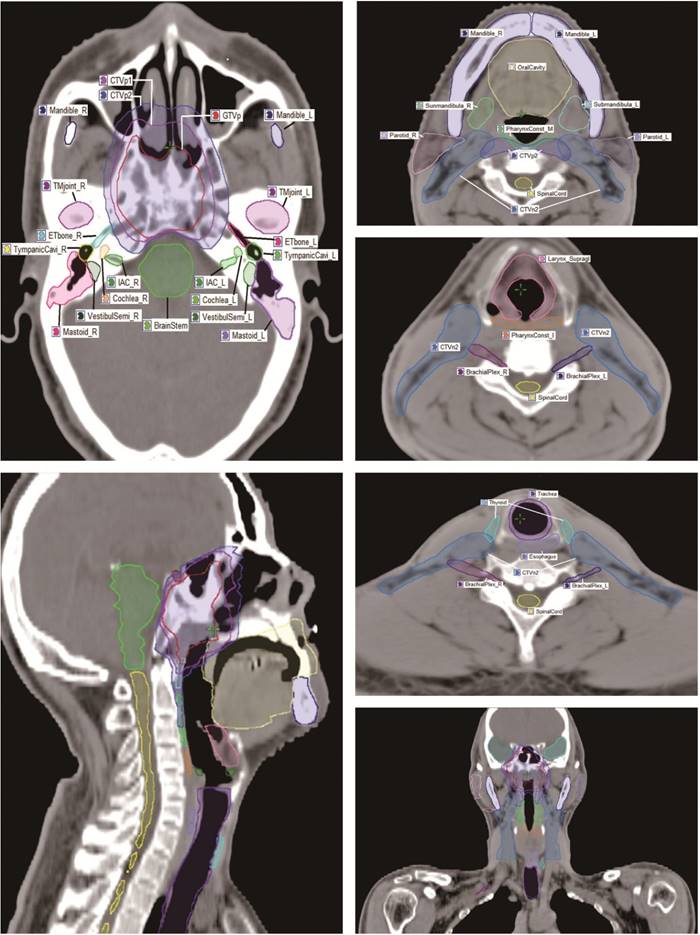
The contouring atlas of target volume and OARs surrounding nasopharynx.
Plan evaluation of the target and OARs
Nine coplanar fields of 6 MV photon beams from a Truebeam (Varian Medical System, Inc., Palo Alto, CA, USA) linear accelerator were generated for each plan in Eclipse. Dose-volume statistics were computed and analyzed. A standard constraint set referring to RTOG0225 (Radiation Therapy Oncology Group, 2008) (Additional file: Table S1) was used for optimization and evaluation. The aim was to achieve 95% of any PTV at or above the prescription dose, 95-98% of any PTV at or above 95% of the PTV dose, no more than 20% of the PTV_7000 at or above 77 Gy (that is, 110% of the PTV_7000 dose), and no more than 5% of any PTV_7000 at or above 80.5 Gy (that is, 115% of the PTV_7000 dose).
The acceptance criteria for OARs used as the guidelines in defining planning objectives were depicted in QUANTEC-2010 (Quantitative analysis of normal tissue effects in the clinic, 2010) (Additional file: Table S2). The analysis included the maximum dose, the mean dose, and a set of appropriate VX (percentage volume receiving less/more than X Gy) and DY (dose received by Y volume) values. Besides the dose and dose-volume parameters in the dose constraints, the priority setting of different targets and structures are also an important parameter to achieve an optimal plan. For instance, high priorities should be given to critical structures and target volumes to ensure the dose limits of these critical structures are not exceeded and the dose coverage of the targets is adequate.
Follow-up and statistical analysis
After radiotherapy completion, the patients were subsequently followed up monthly for the first 3 months, every 3 months through 3 years, every 6 months for the next 2 years, and then annually. The median follow-up period was 9.8 months (range, 5-16 months). Both the descriptive statistics of targeted radiation doses and the proportion of over-dose were calculated. Kruskal-Wallis rank sum test integrated with Nemenyi posthoc multiple comparison was applied to determine the relationship between radiation doses and T&N stage. A level of P < 0.05 was considered to indicate a statistically significant difference. All analyses were performed using R3.1.2.
Results
Target coverage
The plan of each patient was evaluated, and all plans met the planning goals for target coverage. There was no patient with a V110 (percentage volume covering 110% of the prescribed dose) of PTV_7000 exceeding 1%. The V100 (percentage volume covering 100% of the prescribed dose) and V95 (percentage volume covering 95% of the prescribed dose) of PTV_7000, PTV_6000, and PTV_5400 was up to 95% - 100% in all the plans. The V93 (percentage volume covering 93% of the prescribed dose) of PTV_7000, PTV_6000, and PTV_5400 was up to 99% - 100% in all the patients.
Radiation doses to OARs at different stages
Kruskal-Wallis rank sum test revealed that the radiation doses of 15 OARs (e.g. brain stem, temporal lobe, cochlea, etc.) were positively correlated with T stage (P < 0.05), and the radiation doses of each OAR at different T stages were shown in Table 2. For example, the D1 (dose received by 1% of the volume) of TemporalLobe_PRV were 55.40 ± 4.94 Gy, 57.47 ± 2.64 Gy, 61.23 ± 6.66 Gy, and 68.04 ± 6.33 Gy in patients with T1, T2, T3, and T4 stage, respectively. In addition, the radiation doses of 13 OARs (e.g. brachial plexus, parotid, trachea, etc.) increased significantly with N stage (P < 0.05) and the radiation doses of each OAR with different N stages were shown in Table 3. For example, the mean doses of the trachea were 12.89 ± 5.82 Gy, 30.03 ± 9.09 Gy, 33.78 ± 6.99 Gy, and 39.15 ± 8.97 Gy in patients with N0, N1, N2, and N3 stage, respectively. In addition, two OARs (e.g. tympanic cavity and mastoid) were correlated with both T&N stage (P < 0.05). By contrast, the radiation doses of the spinal cord and mandible had no association with T or N stage (P > 0.05).
Table 2
Dosimetry distribution of OARs at different T stages.
| Organ § | Dose metrics metrics | T1 | T2 | T3 | T4 | P-value |
|---|---|---|---|---|---|---|
| BrainStem_PRV | D1 (Gy) ¶ | 53.10±3.45 | 53.44±3.63 | 59.16±6.31 | 63.90±5.88 | <.001 |
| OpticNerve_PRV | D1 (Gy) | 31.95±18.98 | 36.21±18.58 | 47.62±15.79 | 56.93±11.26 | <.001 |
| Chiasm_PRV | D1 (Gy) | 41.11±12.91 | 43.19±12.00 | 53.70±11.48 | 65.64±7.07 | <.001 |
| TemporalLobe_PRV | D1 (Gy) | 55.40±4.94 | 57.47±2.64 | 61.23±6.66 | 68.04±6.33 | <.001 |
| Pituitary | Dmax (Gy) † | 52.33±6.42 | 52.99±7.77 | 58.17±9.71 | 70.98±6.44 | <.001 |
| TM joint | Dmax (Gy) | 49.91±9.49 | 53.47±10.81 | 53.57±10.04 | 59.90±11.14 | <.001 |
| Lens | Dmax (Gy) | 3.11±0.68 | 3.58±1.86 | 5.49±2.77 | 8.50±3.08 | <.001 |
| Eye | Dmean (Gy) ‡ | 4.33±2.16 | 5.16±3.73 | 7.52±3.62 | 12.49±5.49 | <.001 |
| Cochlea | Dmean (Gy) | 43.74±4.86 | 45.90±6.59 | 49.76±9.81 | 57.48±11.62 | <.001 |
| IAC | Dmean (Gy) | 43.24±3.73 | 44.87±4.26 | 49.36±8.64 | 58.67±11.14 | <.001 |
| VestibulSemi | Dmean (Gy) | 36.77±3.97 | 39.09±4.86 | 41.58±7.27 | 48.24±9.09 | <.001 |
| Eustachian tube | Dmean (Gy) | 48.02±6.69 | 48.92±7.33 | 53.03±9.96 | 59.09±11.59 | <.001 |
| OralCavity | D1 (Gy) | 61.70±4.60 | 61.72±5.02 | 63.22±5.24 | 65.33±6.44 | 0.039 |
| TympanicCavity | Dmean (Gy) | 36.77±3.97 | 39.09±4.86 | 41.58±7.27 | 48.24±9.09 | <.001 |
| Mastoid | Dmean (Gy) | 32.09±3.46 | 33.94±4.47 | 34.16±5.66 | 36.04±5.63 | 0.001 |
The radiation doses of OARs are presented as mean ± SD. PRV, planning risk volume; TM joint, temporomandibular joint; IAC, internal auditory canal; VestibulSemi, vestibule and semicircular canal.
§: Radiation dose of OARs associated with T stage; ¶: dose received by 1% of the volume; †: maximum dose; ‡: mean dose.
Table 3
Dosimetry distribution of OARs at different N stages.
| Organ § | Dose metrics | N0 | N1 | N2 | N3 | P-value |
|---|---|---|---|---|---|---|
| BrachialPlexus | Dmax (Gy) † | 59.92±3.53 | 63.21±3.80 | 64.99±4.13 | 68.15±4.46 | <.001 |
| Parotid | Dmean (Gy) ‡ | 30.97±2.29 | 34.67±5.81 | 35.08±5.73 | 36.76±6.28 | <.001 |
| Submandibular | Dmean (Gy) | 47.43±5.61 | 49.63±6.80 | 53.51±8.19 | 55.83±8.51 | <.001 |
| TympanicCavity | Dmean (Gy) | 37.61±5.69 | 41.12±8.12 | 42.81±7.36 | 43.78±8.36 | 0.014 |
| Mastoid | Dmean (Gy) | 31.62±3.02 | 33.68±4.81 | 34.52±4.84 | 35.76±5.26 | 0.021 |
| Larynx_Glottic | Dmean (Gy) | 39.85±2.73 | 41.30±2.58 | 41.44±3.17 | 43.89±5.68 | <.001 |
| Larynx_Supraglottic | Dmean (Gy) | 40.71±1.83 | 43.16±2.81 | 44.41±3.33 | 46.01±4.16 | <.001 |
| PharynxConst_I | Dmean (Gy) | 44.94±2.38 | 46.67±2.86 | 47.56±4.85 | 48.41±3.45 | 0.005 |
| PharynxConst_M | Dmean (Gy) | 54.81±4.66 | 56.98±4.63 | 58.68±3.90 | 60.49±5.06 | <.001 |
| PharynxConst_S | Dmean (Gy) | 59.84±3.59 | 62.82±4.17 | 63.91±4.74 | 65.35±4.48 | <.001 |
| Esophagus | V35 (%) & | 18.91±14.89 | 52.71±23.52 | 62.18±17.95 | 73.27±21.93 | 0.024 |
| Trachea | Dmean (Gy) | 12.89±5.82 | 30.03±9.09 | 33.78±6.99 | 39.15±8.97 | <.001 |
| Thyroid | Dmean (Gy) | 31.85±10.13 | 45.74±8.88 | 49.05±3.99 | 50.30±7.49 | <.001 |
The radiation doses of OARs are presented as mean ± SD. PharynxConst_I, inferior constrictor of pharynx; PharynxConst_M, middle constrictor of pharynx; PharynxConst_S, superior constrictor of pharynx.
§: Radiation dose of OARs associated with N stage; &: percentage volume of esophagus which received >35 Gy radiation; †: maximum dose; ‡: mean dose.
Table 4
Incidence of exceeding tolerance doses for OARs surrounding the nasopharynx.
| OARs | Tolerance doses | T1/N0 | T2/N1 | T3/N2 | T4/ N3 |
|---|---|---|---|---|---|
| Pattern 1 | |||||
| SpinalCord_PRV | D1 <50 (Gy) | 0% (-) | 1.5% (-) | 0% (-) | 0% (-) |
| Mandible | V50 <30% & | 12.3% (+) | 28.1% (+) | 17.2% (+) | 19.4% (+) |
| TMjoint | Dmax <70 (Gy) | 0% (-) | 0% (-) | 6.5% (-) | 25.8% (+) |
| Eye | Dmean <35 (Gy) | 0% (-) | 0% (-) | 0% (-) | 1.6% (-) |
| OralCavity | D1 <70 (Gy) | 0% (-) | 3.1% (-) | 7.2% (-) | 32.3% (+) |
| Larynx_Glottic | Dmean <50 (Gy) | 0% (-) | 0% (-) | 0% (-) | 3.8% (-) |
| Larynx_Supraglottic | Dmean <50 (Gy) | 0% (-) | 5.4% (-) | 5.4% (-) | 19.2% (+) |
| PharynxConst_I | Dmean <50 (Gy) | 0% (-) | 11.9% (+) | 13.5% | 26.9% (+) |
| Trachea | Dmean <45 (Gy) | 0% (-) | 4.5% (-) | 5.4% (-) | 15.4% (+) |
| Pattern 2 | |||||
| BrainStem_PRV | D1 < 60 (Gy) | 0% (-) | 3.1% (-) | 36.2% (+) | 74.2% (++) |
| OpticNerve_PRV | D1 <60 (Gy) | 1.6% (-) | 6.3% (-) | 11.6% (+) | 37.1% (+) |
| Chiasm_PRV | D1 <60 (Gy) | 0% (-) | 6.3% (-) | 26.1% (+) | 67.7% (++) |
| TemporalLobe_PRV | D1 <65 (Gy) | 0% (-) | 0% (-) | 26.8% (+) | 67.7% (++) |
| Pituitary | Dmax <60 (Gy) | 6.3% (-) | 12.5% (+) | 51.2% (+) | 90.3% (+++) |
| Lens | Dmax < 0.6 (Gy) | 0% (-) | 12.5% (+) | 39.9% (+) | 74.2% (++) |
| VestibulSemi | Dmean <45 (Gy) | 3.1% (-) | 9.4% (-) | 26.8% (+) | 61.3% (++) |
| BrachialPlexus | Dmax <66 (Gy) | 0% (-) | 16.4% (+) | 32.4% (+) | 65.4% (++) |
| Esophagus | V35 <50% § | 5.6% (-) | 62.7 (++) | 78.4% (+++) | 92.3% (+++) |
| Pattern 3 | |||||
| Cochlea | Dmean <45 (Gy) | 34.1% (+) | 53.1% (++) | 60.9% (++) | 80.6% (+++) |
| IAC | Dmean <45 (Gy) | 28.1% (+) | 56.2% (++) | 63.1% (++) | 83.9% (+++) |
| Eustachian tube | Dmean <53 (Gy) | 21.9% (+) | 31.3% (+) | 47.8% (+) | 70.9% (++) |
| TympanicCavity | Dmean <34 (Gy) | 75.0% (+++) | 75.0% (+++) | 85.5% (+++) | 87.1% (+++) |
| Mastoid | Dmean <30 (Gy) | 65.6% (++) | 68.8% (++) | 81.2% (+++) | 82.3% (+++) |
| Parotid | Dmean <26 (Gy) | 100% (+++) | 100% (+++) | 100% (+++) | 100% (+++) |
| Submandibular | Dmean <35 (Gy) | 100% (+++) | 100% (+++) | 100% (+++) | 100% (+++) |
| PharynxConst_M | Dmean <50 (Gy) | 77.8% (+++) | 91.0% (+++) | 96.2% (+++) | 97.3% (+++) |
| PharynxConst_S | Dmean <50 (Gy) | 97.3% (+++) | 100% (+++) | 100% (+++) | 100% (+++) |
| Thyroid | Dmean <45 (Gy) | 16.7% (+) | 64.2% (++) | 83.8% (+++) | 88.5% (+++) |
According to the excess rates, OARs were initially classified into four risk grades: (-): excess rate <10%; (+): 10%≤ excess rate <50%; (++):50%≤ excess rate <75%; (+++): excess rate ≥75%.
Pattern 1: easily meeting tolerance doses in all stages; Pattern 2: meeting tolerance doses easily in early stages but with difficulty in advanced stages; Pattern 3: meeting tolerance doses with difficulty in all stages.
&: Percentage volume of mandible which received >50 Gy radiation; §: percentage volume of esophagus which received >35 Gy radiation. Other abbreviations as in Tables 2 and 3.
Characteristics of excess rate
Based on the tolerance dose of each OAR, the excess rates of OARs at different T or N stages are shown in Table 4. The lowest excess rate of OARs was the mean dose to the eye, and it was under 35 Gy in all the patients except a patient with tumor invasion into the left orbital apex. The highest excess rates of OARs were the mean doses to the parotid and submandibular; according to the tolerance dose of each structure, the mean doses to the parotid and submandibular were exceeding tolerance doses in all patients. The excess rates of most OARs increased gradually with clinical stage. For example, the pituitary has been shown to tolerate doses of 60 Gy, and the excess rates to the pituitary were 6.3%, 12.5%, 51.2%, and 90.3% in patients with T1, T2, T3, and T4 stages, respectively.
Patterns of radiation doses to OARs
To quantify the characteristics of overdose in different stages, we analyzed the incidence of exceeding tolerance doses. OARs were initially classified into four risk grades: (Grade 0): excess rate <10%; (Grade 1): 10% ≤ excess rate <50%; (Grade 2): 50% ≤ excess rate <75%; (Grade 3): excess rate ≥75%. The excess rates of 9 OARs (e.g. spinal cord, mandible, TM joint, eye, oral cavity, glottic larynx, supraglottic larynx, inferior constrictor of pharynx, and trachea) were below 10% in almost all stages. The excess rates of another 9 OARs, including the brain stem, optic nerve, chiasm, temporal lobe, pituitary, lens, vestibule and semicircular canal, brachial plexus, and esophagus, were below 10% in early stage disease (T1-2&N0-1) while up to 90% in advanced stage disease (T3-4&N2-3). The excess rates of 10 OARs (cochlea, internal auditory canal, Eustachian tube, tympanic cavity, mastoid, parotid, submandibular, middle constrictor of pharynx, superior constrictor of pharynx, and thyroid) were up to 50-90% in almost all stages. Based on the characteristics of excess rates, OARs were initially classified into three patterns: Pattern 1): met tolerance doses easily in all stages; Pattern 2): met tolerance doses easily in early stages but with difficulty in advanced stages; and Pattern 3): met tolerance doses with difficulty in all stages (Table 4).
Discussion
Today, IMRT is generally accepted as a more advanced radiation technique for the management of NPC. However, effective IMRT in sparing OARs around nasopharynx is largely unknown. Therefore, we conducted this prospective study in order to investigate the patterns of radiation doses to OARs. This study showed that 9 OARs (e.g. spinal cord, eye, trachea, and et al.) met tolerance doses easily in all stages, 9 OARs (e.g. brain stem, temporal lobe, brachial plexus, and et al.) easily in early stages but with difficulty in advanced stages, and 10 OARs (e.g. cochlea, parotid, thyroid, and et al.) with difficulty in all stages.
Radiation doses easily tolerated in all stages
Our data showed that the radiation doses to some OARs were under the tolerance doses easily in all stages. In order to simplify clinical work, can we omit to contour such OARs? The answer may be no. For example, although radiation doses to the spinal cord were under the tolerance doses in almost all patients, the result may have been completely different if we had not contoured it because, in order to protect function, physicists tend to set an appropriate dose parameter for the spinal cord when they optimize the plan. If the spinal cord is not contoured, physicists will find it difficult to control the radiation doses to this OAR. In addition, the cervical spine has been shown to tolerance doses of 50 Gy in conventional fractionation, and higher doses have been associated with cord myelopathy in 35% - 50% of patients [11]. Therefore, we still cannot ignore the delineation of the spinal cord in clinical work. In this study, we used the spinal cord as an example to show the characteristic of this kind of OAR. Similar steps could be taken for the structure of the eye.
Our data also show that the radiation doses to other 7 OARs (including the mandible, TM joint, oral cavity, glottic larynx, supraglottic larynx, inferior constrictor of pharynx, and trachea) only exceed the tolerance doses by a small amount in early stages, and even in patients with stage T4 or N3 only 1.6% - 32.3% of patients exceed tolerance doses. This result suggests that present radiation technology could control the radiation dose to these OARs very well, especially in patients with early stage disease. The implication is that clinicians may not have to pay close attention to these OARs in the evaluation of plans, and to reduce the optimization burden of other OARs, physicists should try to give a relatively lower weighting parameter for those OARs.
Radiation doses were easily tolerated in patients with early stages, but with difficulty in advanced stages
For those OARs, the excess rates were very low in patients with early stages (T1-2&N0-1), but were over 90% in patients with advanced stages (T3-4&N2-3). Of these OARs, brachial plexopathy has rarely been reported and when it occurs, it is usually in patients irradiated for breast cancer with doses per fraction >3 Gy [12]. Therefore, most clinicians pay little attention to the protection of the brachial plexus, and they do not delineate the brachial plexus in clinical work. In this study, although we do not find any patient with doses above the tolerance dose in patients with N0 disease, the excess rate of the brachial plexus was up to 68.5% in patients with N3 disease, and the maximum radiation dose reached 78.5 Gy. In addition, the radiation doses to the brachial plexus were beyond the tolerance doses in all patients with positive lymph nodes in the supraclavicular fossa. Thus, omitting the delineation of brachial plexus is acceptable for patients with N0 stage, but in patients with N2-3, especially for patients with positive lymph nodes in supraclavicular fossa, we strongly suggest that clinicians should contour this structure and give an appropriate dose limit.
Our data also show that the radiation dose to brain stem, optic nerve, chiasm, temporal lobe, pituitary, lens, vestibule semi, and esophagus were less than tolerance doses in most patients with early stage disease, but greatly exceeded tolerance levels in patients with advanced stage disease. This result may be explained as follows: the tumor staging is proportional to the site of tumor invasion and the wider of tumor invasion the closer to the surrounding OARs it will be, which will increase the risk of unnecessary radiation. For example, the excess rates of temporal lobe are 0% in patients with early stage disease (no more than parapharyngeal extension); however, it will be up to 100% in patients with tumor invasion into the cavernous sinus. Therefore, we analyzed the sites of tumor invasions for this group of OARs in our study and we found that the radiation doses of these OARs mainly depending on the sites of tumor invasion (Fig. 2). In order to improve the efficiency of the plan evaluation, we suggest that it is necessary to determine the degree of attention to this kind of OARs according to the sites of tumor invasion.
Radiation doses were difficultly tolerated in all stages
It is well recognized that the probability of adverse events is proportional to the radiation dose of the corresponding OARs. For the 10 OARs in this group (e.g. the parotid, cochlea and tympanic cavity, et al.), the radiation dose exceeds tolerance doses severely in all stages, and the excess rate was even up to 100%; therefore, patients were likely to have a high incidence of adverse effects in the corresponding OAR. For example, in our study, we found that the mean dose of parotid and submandibular were beyond the tolerance doses in all patients. Although we did not calculate the occurrence of adverse events in our study, many previous studies have reported that radiation-induced xerostomia is the most common adverse event after radiotherapy, observed at a rate as high as 97.5% in NPC patients [13]. The factors underlying this observation may be interpreted as follows: the parotid gland has a high risk of relapse and clinicians are prone to delineate the part of the parotid into CTVp2, especially for patients with large retropharyngeal lymph nodes and II lymph nodes. For this kind of patient, we suggest that clinicians should additionally contour the normal parotid (outside the target areas), and should restrict the radiation dose to the normal parotid gland as much as possible.
Figure 2
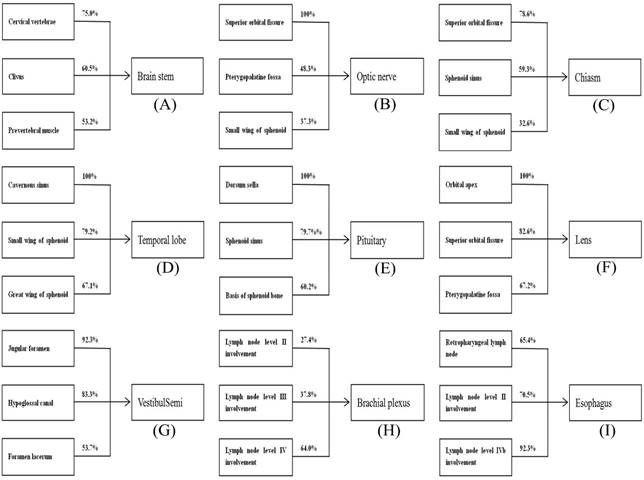
The incidence rates for exceeding tolerance doses for some OARs based on the sites of tumor invasion.
In this study, we delineated the OARs accurately and the physicists also optimized the radiation doses to the OARs; however, tolerance doses were exceeded to a great extent in some OARs. For example, the parotid has been shown to tolerate doses of 26 Gy, whereas the radiation doses to the parotid for patients with N0, N1, N2 and N3 stages were 30.97 ± 2.29 Gy, 34.67 ± 5.81 Gy, 35.08 ± 5.73 Gy, and 36.76 ± 6.28 Gy, respectively. The factors underlying this observation may be interpreted as follows. Firstly, the recommendation of dose constraints for this kind of OAR may not be suitable enough with current radiation technology. On the other hand, physicists are prone to sacrifice the radiation dose of low priority OARs (e.g. the cochlea, parotid, thyroid, etc.) in order to improve the radiation dose of the target coverage and limit the radiation dose to critical OARs, such as the temporal lobe and spinal cord.
Conclusions
The radiation doses to most of OARs are associated with T or N stage in NPC patients. Based on the characteristic of excess rate, 9 OARs (e.g. spinal cord, eye, trachea, and et al.) met tolerance doses easily in all stages, 9 OARs (e.g. brain stem, temporal lobe, brachial plexus, and et al.) easily in early stages but with difficulty in advanced stages, and 10 OARs (e.g. cochlea, parotid, thyroid, and et al.) with difficulty in all stages. According to the patterns of radiation doses to OARs, it may help us to further reduce subsequent complications by improving the efficiency of plan optimization and evaluation. However, the median follow-up time for all patients was only 9.8 months, thus late toxicity was not evaluated. As a result, the relationship between radiation doses of OARs and toxicities requires further study.
Supplementary Material
Supplementary tables.
Acknowledgements
This work was funded by the Science and Technology Project of Guangzhou City, China (No. 14570006), the National Natural Science Foundation of China (No.81372409), the Sun Yat-sen University Clinical Research 5010 Program (No.2012011), and the National Natural Science Foundation of China (No.81402532).
Competing Interests
The authors declare that they have no conflict of interest.
References
1. Wei KR, Zheng RS, Zhang SW, Liang ZH, Ou ZX, Chen WQ. Nasopharyngeal carcinoma incidence and mortality in China in 2010. Chin J Cancer. 2014;33(8):381-7
2. Bray F, Ferlay J, Laversanne M. et al. Cancer Incidence in Five Continents: Inclusion criteria, highlights from Volume X and the global status of cancer registration. Int J Cancer. 2015;137(9):2060-71
3. Kam MK, Teo PM, Chau RM. et al. Treatment of nasopharyngeal carcinoma with intensity-modulated radiotherapy: The Hong Kong experience. Int J Radiat Oncol Biol Phys. 2004;60(5):1440-50
4. Lin S, Pan J, Han L, Zhang X, Liao X, Lu JJ. Nasopharyngeal carcinoma treated with reduced-volume intensity-modulated radiation therapy: report on the 3-year outcome of a prospective series. Int J Radiat Oncol Biol Phys. 2009;75(4):1071-8
5. Petsuksiri J, Sermsree A, Thephamongkhol K. et al. Sensorineural hearing loss after concurrent chemoradiotherapy in nasopharyngeal cancer patients. Radiat Oncol. 2011;6:19
6. Li WF, Sun Y, Chen M. et al. Locoregional extension patterns of nasopharyngeal carcinoma and suggestions for clinical target volume delineation. Chin J Cancer. 2012;31(12):579-87
7. ICRU report. Vol. 50: Prescribing, recording, and reporting photon beam therapy. Maryland: International Commission on Radiation Units and Measurements. 1993
8. ICRU Report. Vol. 62: Prescribing, recording, and reporting photon beam therapy (supplement to ICRU report 50). Maryland: International Commission on Radiation Units and Measurements. 1999
9. Sun Y, Yu XL, Luo W. et al. Recommendation for a contouring method and atlas of organs at risk in nasopharyngeal carcinoma patients receiving intensity-modulated radiotherapy. Radiother Oncol. 2014;110(3):390-7
10. Fowler JF, Bentzen SM, Bond SJ. et al. Clinical radiation doses for spinal cord: the 1998 international questionnaire. Radiother Oncol. 2000;55(3):295-300
11. Fowler JF, Bentzen SM, Bond SJ. et al. Clinical radiation doses for spinal cord: the 1998 international questionnaire. Radiother Oncol. 2000;55(3):295-300
12. Gałecki J, Hicer-Grzenkowicz J, Grudzień-Kowalska M, Michalska T, Załucki W. Radiation-induced brachial plexopathy and hypofractionated regimens in adjuvant irradiation of patients with breast cancer-a review. Acta Oncol. 2006;45(3):280-4
13. Sumitsawan Y, Chaiyasate S, Chitapanarux I. et al. Late complications of radiotherapy for nasopharyngeal carcinoma. Auris Nasus Larynx. 2009;36(2):205-9
Author contact
![]() Corresponding author: Ying Sun, Department of Radiation Oncology, Sun Yat-sen University Cancer Center, 651 Dongfeng Road East, Guangzhou, Guangdong 510060, People's Republic of China. Telephone: +86-20-87342253 Fax: +86-20-87343295 Email: sunyingorg.cn.
Corresponding author: Ying Sun, Department of Radiation Oncology, Sun Yat-sen University Cancer Center, 651 Dongfeng Road East, Guangzhou, Guangdong 510060, People's Republic of China. Telephone: +86-20-87342253 Fax: +86-20-87343295 Email: sunyingorg.cn.
Citation styles
APA
Xu, L., Yao, J.J., Zhou, G.Q., Zhang, W.J., Liu, G.L., Liu, L.Z., Ma, J., Sun, Y. (2016). The Impact of Clinical Stage on Radiation Doses to Organs at Risk Following Intensity-modulated Radiotherapy in Nasopharyngeal Carcinoma: A Prospective Analysis. Journal of Cancer, 7(14), 2157-2164. https://doi.org/10.7150/jca.16476.
ACS
Xu, L.; Yao, J.J.; Zhou, G.Q.; Zhang, W.J.; Liu, G.L.; Liu, L.Z.; Ma, J.; Sun, Y. The Impact of Clinical Stage on Radiation Doses to Organs at Risk Following Intensity-modulated Radiotherapy in Nasopharyngeal Carcinoma: A Prospective Analysis. J. Cancer 2016, 7 (14), 2157-2164. DOI: 10.7150/jca.16476.
NLM
Xu L, Yao JJ, Zhou GQ, Zhang WJ, Liu GL, Liu LZ, Ma J, Sun Y. The Impact of Clinical Stage on Radiation Doses to Organs at Risk Following Intensity-modulated Radiotherapy in Nasopharyngeal Carcinoma: A Prospective Analysis. J Cancer 2016; 7(14):2157-2164. doi:10.7150/jca.16476. https://www.jcancer.org/v07p2157.htm
CSE
Xu L, Yao JJ, Zhou GQ, Zhang WJ, Liu GL, Liu LZ, Ma J, Sun Y. 2016. The Impact of Clinical Stage on Radiation Doses to Organs at Risk Following Intensity-modulated Radiotherapy in Nasopharyngeal Carcinoma: A Prospective Analysis. J Cancer. 7(14):2157-2164.
This is an open access article distributed under the terms of the Creative Commons Attribution (CC BY-NC) License. See http://ivyspring.com/terms for full terms and conditions.