Journal of Cancer
ISSN: 1837-9664
3.2
Impact Factor
ISSN: 1837-9664

 Global reach, higher impact
J Cancer 2016; 7(8):928-934. doi:10.7150/jca.13968 This issue Cite
Research Paper
Correlation of GOLPH3 Gene with Wnt Signaling Pathway in Human Colon Cancer Cells
Cheng-Zhi Qiu ![]() , Ming-Zhen Wang, Wai-Shi Yu, Yan-Ta Guo, Chun-Xiao Wang, Xiao-Feng Yang
, Ming-Zhen Wang, Wai-Shi Yu, Yan-Ta Guo, Chun-Xiao Wang, Xiao-Feng Yang
Department of General Surgery, the Second Affiliated Hospital of Fujian Medical University, Quanzhou 362000, Fujian Province, China.
Received 2015-9-26; Accepted 2016-3-16; Published 2016-5-7
Citation:
Qiu CZ, Wang MZ, Yu WS, Guo YT, Wang CX, Yang XF. Correlation of GOLPH3 Gene with Wnt Signaling Pathway in Human Colon Cancer Cells. J Cancer 2016; 7(8):928-934. doi:10.7150/jca.13968. https://www.jcancer.org/v07p0928.htm
Other stylesAbstract
Objective: Overexpression of GOLPH3 in colorectal cancer tissue may promote cell proliferation and activate the Wnt signaling pathway. We investigated the correlation between GOLPH3 gene expression and the Wnt signaling pathway to explore the mechanism of the overexpression of GOLPH3 gene which promotes proliferation in human colon cancer cells.
Methods: We measured expression of GOLPH3 mRNA in the human colon cancer cell lines HCT116, HT29, SW480 and SW620 by RT-PCR, and the cells with the highest expression were selected and divided into four groups: negative control, GOLPH3 siRNA transfection (siRNA-GOLPH3), Akt inhibitor (Tricinbine), and glycogen synthase kinase (GSK)-3β inhibitor (TWS119). After human colon cancer cells were transfected with siRNA-GOLPH3, we used RT-PCR to investigate the silencing effect of GOLPH3 gene. We assessed the activity of the Wnt signaling pathway in all groups using the Topflash method. Proliferation and apoptosis of colon cancer SW620 cells were detected by MTT assay, colony formation assay and flow cytometry. Expression of Golgi phosphoprotein (GOLPH)3, β-catenin, GSK-3β and pS9-GSK-3β in cancer cells was determined by Western blotting.
Results: SW620 cells expressed the highest level of GOLPH3 mRNA, and the silence effect was good after they were transfected with siRNA-GOLPH3. The relative luminescence units (RLU) values in the experimental groups were significantly lower than in the negative control group (P<0.001). There was no significant difference in the RLU values among the experimental groups (P> 0.05). The growth inhibition ratio and apoptosis rate of cancer cells in each experimental group were significantly higher than those in the control group, and the cell colony count in the experimental group was significantly lower than in the control group (P<0.05). In addition, the RLU value, proliferation and apoptosis rate of cancer cells did not differ significantly between each two experimental groups. Western blotting showed that, compared with the control group, expression of β-catenin and pS9-GSK3 proteins were significantly decreased in the experimental group. Expression of GSK-3β in the experimental group did not different from that of the control group.
Conclusions: Overexpression of GOLPH3 gene activated the Wnt signaling pathway, as well as increasing expression of β-catenin, promoting proliferation and inhibiting apoptosis in human colon cancer cells. The mechanism of action was that overexpression of GOLPH3 gene activated Akt, which may also further activate the Wnt signaling pathway via GSK-3β, and promote proliferation in human colon cancer cells.
Keywords: Colon cancer cells, GOLPH3, Wnt signaling pathway, Akt, glycogen synthase kinase-3β, β-catenin.
Introduction
Colon cancer is the most common of the digestive neoplasms and the fourth most frequent cause of cancer-related death worldwide, and its incidence continues to show an upward trend. Carcinogenesis and progression of colon cancer are still unclear, but the disease course is accompanied by numerous genetic alterations, including oncogenes and tumor suppressor genes, such as P53, PTEN and K-ras. These genes act on different loci in the intracellular signal transduction cascade, and influence cancer cell growth, proliferation and apoptosis. There are two important intracellular signaling pathways in colon cancer, PI3K/Akt/mTOR and Wnt/β-catenin, which are closely related to differentiation, proliferation, migration and adhesion of cancer cells, and also have many attractive potential targets1.
Golgi phosphoprotein (GOLPH)3, also known as GPP34, is localized on human chromosome 5p13; a region that is frequently amplified in several types of solid tumor. Recent studies indicate that GOLPH3 can activate the PI3K/AKT/mTOR signaling pathway through phosphorylation both of mammalian target of rapamycin complex (mTORC)1 and mTORC2, resulting in cell proliferation2-4. GLOPH3 is a novel oncogene that is overexpressed in prostate cancer5, gastric cancer6,7, hepatic carcinoma8,9 and pancreatic ductal adenocarcinoma10, but also correlated with poor prognosis.
Besides the PI3K/Akt/mTOR signaling pathway, the other mechanism by which GOLPH3 promotes cell proliferation remains uncertain. Our previous study proved that overexpression of GOLPH3 was significantly correlated with β-catenin expression in colorectal cancer tissue. We propose that GOLPH3 can activate the intracellular Wnt/β-catenin signaling pathway and promote cell proliferation. The objectives of this study were to investigate the relationship between GOLPH3 overexpression and activity of the Wnt signaling pathway in colon cancer cells, and further explore its possible mechanism via inhibition of Akt or glycogen synthase kinase (GSK)-3β. We found that knockdown of GOLPH3 inhibited human colon cell proliferation, β-catenin expression and activity of the Wnt signaling pathway, and induced apoptosis. The mechanism included GOLPH3 gene activation of Akt and enhancement of Wnt signaling mediated by GSK-3β, which resulted in proliferation of human colon cancer cells.
Materials and Methods
Cell lines and cell culture
Four human colorectal cancer cell lines HCT116, HT129, SW480 and SW620 were purchased from the Type Culture Collection of the Chinese Academy of Sciences (Shanghai, China). All cell lines were maintained in RPMI-1640 medium (Invitrogen, Carlsbad, CA, USA) supplemented with 10% fetal bovine serum and grown in a humidified incubator with 5% CO2 at 37°C.
RNA extraction and quantitative RT-PCR
Total RNA was extracted from cultured cells using the TRIzol reagent (Invitrogen). Two micrograms of total RNA from each sample was reverse transcribed into cDNA using SuperScript III Reverse Transcriptase kit (Invitrogen). Quantitative PCR was performed using the SYBR Ex Taq kit (Takara Bio, Japan) and the ABI 9700 qRT-PCR detection system (Applied Biosystems, Foster City, CA, USA). The quantitative PCR conditions were initial degeneration for 20 s at 95°C, followed by 45 cycles of denaturation for 10 s at 95°C, annealing for 20 s at 60°C and extension for 20 s at 72°C. All PCR primers were synthesized by Zimmer AG (Shanghai, China). The primers sequences were as follows. GOLPH3 forward: 5′-AGGGCGACTCCAAGGAAA-3′; reverse: 5′-TGATGTGTAACCCTCGCG-3′ and primers to amplify GAPDH contained: 5′-GGTCATAAGCTTGCGTTGATTAAG-3′ (forward) and 5′-CTACGGAAACCTTGTTACGACTTT-3′ (reverse). Using GAPDH as an internal reference, the relative expression level was calculated by using the 2-ΔΔCT equation.
Colon cancer cell lines with high expression of GOLPH3 were divided into four groups: control group (Equivalent PBS), siRNA transfection group, Tricinbine group (Akt inhibitor) and TWS119 group (GSK-3β inhibitor). We continued to culture the cells, and detected expression of GOLPH3 mRNA in the group with siRNA transfection, as for the RT-PCR method.
Determination of Wnt signaling pathway activity
The culture medium was removed and the cells washed with PBS. When adding 100 μl Harvest buffer to lyse the cells 10 min later, we withdrew 40 μl lysate into the centrifuge tube and added 20 μl firefly luciferase substrate or Renilla luciferase substrate (Beyotime Biotechnology, Nanking, China). Once mixing evenly by vortex, we detected firefly and Renilla luciferase fluorescence with a photometer (Beckman Coulter America). The ratio of the above two values [relative luminescence units (RLU) value] indicated the activity of cellular transcription factors in the Wnt signaling pathway.
Cell proliferation (MTT) assay
The cell suspension was inoculated into a 96-well plate, with each well receiving 100 μl (105 cells), and cultured by the anchorage-dependent way for 24 h. Next each group set up four double wells and four control wells that only contained cells without any other treatment. After 48 h culture, 10 μl of 5 mg/ml MTT (Sigma, St Louis, MO, USA) was added to each well, followed by further culture for 4 h, after which, the culture medium was discarded. To each well, we added 150 μl DMSO (Sigma), and the wells were mixed by oscillation in the dark. OD490 was measured with a microplate reader (Huadong Electronics, China) after the crystals dissolved. The formula: Rate of growth inhibition in cancer cells = (1 - average OD490 in treatment groups/average OD490 in control groups) × 100%.
Colony formation assay
Cells in logarithmic growth phase were inoculated into six-well plates containing complete culture medium and 500 cells per well. During the next 3 weeks, the medium was changed once every 3 days. Once the clones became visible, culture was terminated; the cells were washed with PBS and fixed in 100% methanol. After staining with crystal violet dye for 30 min, the cells were washed three times with PBS and clones were counted under an inverted microscope. Clones were colonies of ≥50 cells. The above steps were repeated three times and the average was calculated.
Apoptotic assay
Centrifuge the cell suspension at 1,000 rpm for 3 minutes and remove supernatant. Add PBS for wash cells and centrifuge at 1,000 rpm for 3 minutes, remove supernatant. Repeat this step one more time. Add 10-fold diluted Annexin V Binding Solution to make final cell concentration of 1×10⁶ cells/ml. Transfer 100 μl of cell suspension to a new tube. Add 5 μl of Annexin V, FITC Conjugate, then 5 μl of PI Solution to the cell suspension. Incubate 15 minutes at room temperature with protect from light. Add 400 μl of 10-fold diluted Annexin V Binding Solution. Apply the solution to flow cytometric assay (Beckman Coulter, America).
Western blotting analysis
Each cell line in logarithmic growth phase was washed with PBS. The cells were lysed in RIPA lysis buffer (containing 50 mM Tris-HCl, pH 7.4, 150 mM NaCl, 0.1% SDS, 1 mM EDTA, 1% Triton X-100, 1 mM PMSF, and 1 mM Protease Inhibitor Cocktail) for 20 min on ice with occasional vortex mixing. Protein concentrations were determined using the BCA assay kit (wegenebio, China). Protein concentrates of cell lysates (30 μg per lane) were separated by 10% SDS-PAGE and transferred electrophoretically to nitrocellulose membranes (solarbio, China). Membranes were blocked with 5% skimmed milk in TBST for 1 h at room temperature. The blots were incubated with antibodies against GOLPH3 (Abcam, Cambridge, UK); pS9-GSK-3β (Cell Signaling Technology, Danvers, MA, USA); GSK-3β (Santa Cruz Biotechnology, Santa Cruz, CA, USA); β-catenin (Santa Cruz Biotechnology); β-actin (Santa Cruz Biotechnology) at 4°C overnight. After being washed three times with PBST for 10 min, the membranes were incubated with horseradish peroxidase-conjugated secondary antibodies (Santa Cruz Biotechnology) for 1 h at room temperature. The bands were visualized with a chemiluminescence detection kit (ECL, Rockford, IL, USA) and the result was analyzed by Image J Software. Relative intensity target protein = target band of gray value/β-actin band gradation value. β-Actin was used as a loading control.
Statistical analysis
SPSS version 19.0 was used for data processing, and data were expressed as mean ± SD. Dunnett's t test was used to compare the experimental and control groups. Differences between the experimental groups were compared using one-way ANOVA. Differences between paired experimental groups were compared using Student-Newman-Keuls q test. P<0.05 indicated significant differences.
Results
Expression of GOLPH3 in human colon cancer cell lines
We measured the expression level of GOLPH3 mRNA in colon cancer cell lines HCT116, HT29, SW480 and SW620, using RT-PCR. SW620 cells had the highest level of expression (Figure 1). Compared to the control group, the relative expression of GOLPH3 mRNA in siRNA-transfected group was significantly decreased (P<0.001). The expression level of mRNA GOLPH3 in SW620 carcinoma cells was successfully silenced by siRNA transfection (Figure 2).
Figure 1
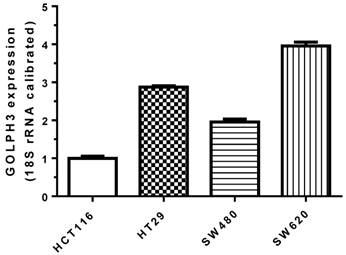
Expression of GOLPH3 mRNA in various colon cancer cell groups. The expression of mRNA GOLPH3 was detected by RT-PCR after four kinds of cancer cells were cultured under the same conditions.
Figure 2
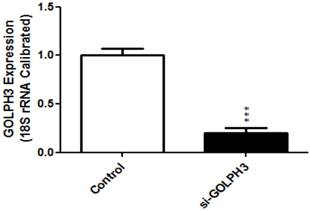
GOLPH3 mRNA expression in control group and transfection group. Values are expressed as percentage of untreated control. *** indicates statistical significance. P<0.001 compared with control group.
Detection of Wnt signaling pathway activity
We used the Topflash reporter assay to compare activation of the Wnt signaling pathway among the cell lines. The RLU values (relative luciferase activity) of the three experimental groups (siRNA-GOLPH3, Tricinbine and TWS119) were significantly lower than in the control group (P<0.01). Compared with each two of the experimental groups, the RLU value did not differ significantly in cancer cells (P>0.05). Consequently, silencing GOLPH3 gene expression, blocking Akt loci and inhibiting GSK-3β can decrease activation of the Wnt signaling pathway in SW620 colon cancer cells (Figure 3).
Proliferation and apoptosis of cancer cells
MTT assay showed that each OD490 value of the experimental groups (siRNA-GOLPH3 transfection, Tricinbine and TWS119) was lower than in the control group (P<0.001) (Figure 4). Similar results were found in the plate clone-forming assay (Figure 5), in which the colony number of tumor cells in each experimental group was significantly lower than in the control group (P<0.001). Besides, the apoptosis rate of cancer cells in the experimental group was significantly increased (P<0.001) (Figure 6A, B). These findings revealed that silencing GOLPH3 gene expression, blocking Akt loci and inhibiting GSK-3β all inhibit SW620 colon cancer cell proliferation and promote apoptosis of cancer cells. In addition, the RLU value, proliferation and apoptosis rate of cancer cells did not differ significantly in each two of the experimental groups.
Figure 3
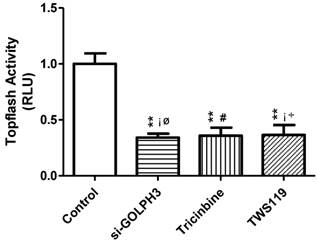
RLU values in various groups of SW620 colon cancer cells. The activity of Wnt signaling pathway in cancer cells was detected by Topflash. Dunnett-t test was used to compare the experimental group and control group, and SNK-q test was used to compare the paired experimental groups. **: P<0.01 compared with control group; ▲: P>0.05 compared with Tricinbine group; #: P>0.05 compared with TWS119 group; △: P>0.05 compared with si-Golph3 group.
Figure 4
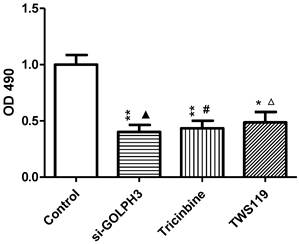
The influence of different processing on SW620 colon cancer cell proliferation inhibition. The cell growth inhibition rate was calculated by measuring the absorbance at the wavelength of 490nm. The growth inhibition rates of si-GOLPH3 group, Tricinbine group and TWS119 group were 59.9%, 56.6%, 51.3%, respectively. *: P<0.05, **: P<0.01 compared with control group; ▲: P>0.05 compared with Tricinbine group; #: P>0.05 compared with TWS119 group; △: P>0.05 compared with si-Golph3 group.
Figure 5
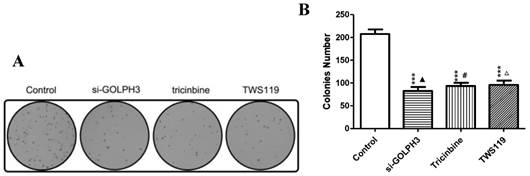
A. Colony image of SW620 colon cancer cells in each group. B. The comparison of SW620 colon cancer cell colony numbers. ***: P<0.001 compared with control group; ▲: P>0.05 compared with Tricinbine group; #: P>0.05 compared with TWS119 group; △: P>0.05 compared with si-Golph3 group.
Figure 6
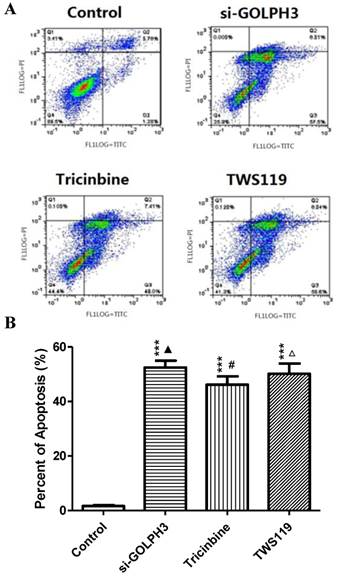
A. Apoptosis of colon cancer cells in SW620 cells was detected by Annexin-FITC/Pl double staining method. B. The comparison of apoptosis of SW620 colon cancer cells between groups. There was no significant difference between the three experimental groups.
Western blotting
The above results showed similar effects on cell proliferation and apoptosis in the three experimental groups. We detected expression of β-catenin, GSK-3β, pS9-GSK-3β and GOLPH3 by Western blotting (Figure 7A, B, Table 1). Compared to the control group, expression of GOLPH3, pS9-GSK3β and β-catenin proteins was significantly decreased in the siRNA-GOLPH3 group (P<0.001), but the level of GSK-3β did not differ significantly in the Tricinbin group (P>0.05). Expression of β-catenin was lower in the siRNA-GOLPH3 and Tricinbine groups than in the TWS119 group. Expression of GOLPH3 protein was lower in the siRNA-GOLPH3 group than in the other experimental groups, and there was no difference between the latter two groups.
Table 1
Expression of GOLPH3, β-catenin, GSK3β and pS9-GSK3β protein.
| Control | si-GOLPH3 | Tricinbine | TWS119 | |
|---|---|---|---|---|
| GOLPH3 | 1.00±0.015 | 0.260±0.008*** | 0.906±0.006△ | 0.983±0.078△ |
| β-catenin | 1.00±0.088 | 0.182±0.010*** | 0.192±0.073*** | 0.362±0.018*** |
| GSK-3β | 1.00±0.301 | 1.085±0.079△ | 0.973±0.247△ | 0.780±0.078△ |
| pS9-GSK3β | 1.00±0.194 | 0.280±0.043*** | 0.208±0.065*** | 0.371±0.160*** |
Data represent the mean±SD expressed as percentage of untreated control.
△: P>0.05 compared with control group. **: P<0.01 compared with control group.
Figure 7
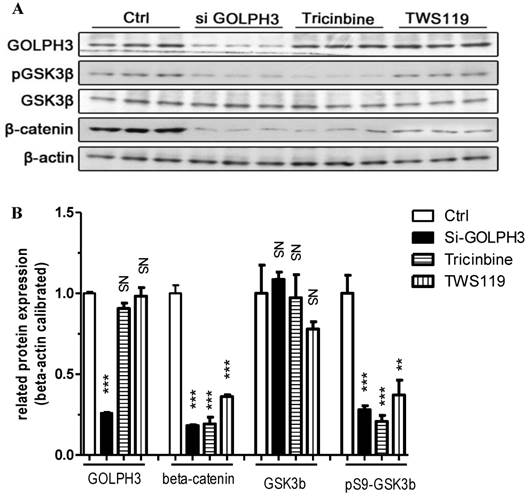
Expression of GOLPH3, β-catenin, GSK3β and pS9-GSK3β protein detected by Western blot. Representative images of three individual experiments, and β-actin was the loading control. ***: P<0.001; **: P<0.01; NS, △: P>0.05 compared with control group. A: Western blot protein band images. B: Quantitative analysis of Western blot.
Discussion
The intracellular signal transduction pathway plays a crucial role in the development, proliferation and metastasis of tumor cells. Excessive activation of the typical Wnt signaling pathway can lead to abnormal expression and nuclear accumulation of β-catenin. Furthermore, it activates the target genes of cyclin D1, which promote the development of tumor cells. It has been confirmed that the Wnt signaling pathway of tumor cells, such as colorectal cancer cells, can be overactivated, which is closely related to the development of tumors11,12. As a new proto-oncogene, GOLPH3 can promote tumor cell proliferation by activating the PI3K/Akt/mTOR signaling pathway4. However, research about the correlation between GOLPH3 and the Wnt/β-catenin signaling pathway of colorectal cancer cells is still not being undertaken.
Our previous studies showed a positive correlation between excess expression of GOLPH3 protein in poorly differentiated human colorectal cancer cells, lymph node metastasis and advanced cancer stage. Besides, the expression of GOLPH3 protein was negatively correlated with apoptosis13-15. This phenomenon is associated with abnormal expression of β-catenin in colorectal cancer, which may activate the Wnt signaling pathway. Furthermore, we found that silencing expression of GOLPH3 gene inhibited the growth and proliferation of colon cancer cells and promoted apoptosis, through using transfection technology. Similar results have been reported for breast cancer, esophageal squamous cell carcinoma and other cancers16,17. At the same time, silencing GOLPH3 gene can decrease the activity of the Wnt signaling pathway and expression of β-catenin protein, which suggests that excess expression of GOLPH3 gene can active the Wnt signaling pathway and increase β-catenin protein expression, which promotes cancer cell proliferation.
Overexpression of GOLPH3 can activate Akt by phosphorylation of Ser473. Substrates of activated Akt include mTOR and GSK-3β18. As a regulatory factor of the Wnt/β-catenin signaling pathway, GSK-3β is also involved in regulating cell proliferation and apoptosis by its effect on β-catenin19,20. We found that by silencing expression of GOLPH3 gene, blocking Akt and GSK3β can inhibit proliferation of colon cancer cells and activity of the Wnt signaling pathway, and promote apoptosis of SW620 cells. There was no significant difference in Wnt signaling pathway activity and proliferation and apoptosis of colon cancer cells in each experimental group. Therefore, we speculate that overexpression of GOLPH3 gene can promote the proliferation of colon cancer cells by activating the Wnt signaling pathway through Akt/GSK-3β/β-catenin.
We found that expression of β-catenin in the group with added GSK-3β inhibitor was higher than that in the other two groups, but the expression of GSK-3β and pS9-GSK3β was not significantly different in each group. Therefore, we infer that GOLPH3 may also activate the Wnt signaling pathway by other means. Some studies have shown that GOLPH3 can affect the activity of the Wnt signaling pathway, mediated by VPS35, which is probably by regulating the transport of Wnt protein between endosomes and the Golgi4,21. Another possible mechanism may be by interfering with the recovery and recycling of Wntless, which plays a key role in Wnt protein secretion22,23. Therefore, further study of the relationship between GOLPH3 gene and Wnt signaling pathway in colorectal cancer cells is needed.
In conclusion, overexpression of GOLPH3 gene in SW620 colon cancer cells can promote cancer cell proliferation and inhibit apoptosis by activating the Wnt signaling pathway. The mechanism may be that overexpression of GOLPH3 gene activates Akt, and further activates the Wnt signaling pathway mediated by GSK-3β. GOLPH3 can be used as a potential therapeutic target against colon cancer.
Acknowledgements
We wish to thank Prof. Huang Weifeng and members of the field laboratory for their helpful advice, reagents, and support. The study was supported by the Nursery Fund and Research Fund of the Second Affiliated Hospital of Fujian Medical University, and Fujian Natural Science Foundation of China.
Competing Interests
The authors declare that there is no competing interest related to this study.
References
1. Aronova S, Wedaman K, Anderson S. et al. Probing the membrane environment of the TOR kinases reveals functional interactions between TORC1, actin, and membrane trafficking in Saccharomyces cerevisiae. Mol Biol Cell. 2007;18:2779-2794
2. Scott KL, Chin L. Signaling from the Golgi: mechanisms and models for Golgi phosphoprotein 3-mediated oncogenesis. Clin Cancer Res. 2010;16:2229-2234
3. Farber-Katz SE, Dippold HC, Buschman MD. et al. DNA damage triggers Golgi dispersal via DNA-PK and GOLPH3. Cell. 2014;156:413-427
4. Scott KL, Kabbarah O, Liang MC, et a1. GOLPH3 modulates mTOR signaling and rapamycin sensitivity in cancer. Nature. 2009;459:1085-1090
5. Li WZ, Guo FF, Gu M, et a1. Increased Expression of GOLPH3 is Associated with the Proliferation of Prostate Cancer. J Cancer. 2015;6:420-429
6. Hu BS, Hu H, Zhu CY. et al. Overexpression of Golph3 is associated with poor clinical outcome in gastric cancer. Tumour Biol J. 2013;34:515-520
7. Peng JZ, Fang Y, Tao Y. et al. Mechanisms of GOLPH3 Associated with the Progression of Gastric Cancer: A Preliminary Study. PLoS One. 2014;9:e107362
8. Dai T, Zhang D, Cai M. et al. Golgi phosphoprotein 3 (GOLPH3) promotes hepatocellular carcinoma cell aggressiveness by activating the NF-kB pathway. J Pathol. 2015;235:490-501
9. Hu GS, Li YQ, Yang YM, Shi W, Liao AJ, Yao YH, Zeng B, Yuan J. High expression of Golgi phosphoprotein-3 is associated with poor survival in patients with hepatocellular carcinoma. Tumour Biol. 2014;35:8625-8632
10. Zhang LJ, Wang KB, Liu LS. et al. Overexpression of GOLPH3 is associated with poor prognosis and clinical progression in pancreatic ductal adenocarcinoma. BMC Cancer. 2014;14:571
11. Nathália G. Amado, Danilo Predes, Marcela M. Moreno, et al. Flavonoids and Wnt/β-Catenin Signaling: Potential Role in Colorectal Cancer Therapies. Int J Mol Sci. 2014;15:12094-12106
12. A Syed Sameer, Zaffar A Shah, Safiya Abdullah, Nissar A Chowdri, Mushtaq A Siddiqi. Analysis of molecular aberrations of Wnt pathway gladiators in colorectal cancer in the Kashmiri population. Hum Genomics. 2011;5:441-452
13. Qiu CZ, Yu WS, Wang CX. Expression and clinical significance of Golgi phosphorylation protein 3 in colorectal cancer tissues. Chin J Exp Surg. 2013;30:461-463
14. Yu WS, Qiu CZ, Wang CX. Golph3 expression and apoptosis in colorectal cancer cells. J Clin Oncol. 2013;40:1094-1463
15. Zhou ZP, Qiu CZ, Yu WS, Yang XF. Relationship between golgi phosphoprotein 3 expression and Wnt/β-catenin signaling in colorectal cancer tissue. Chin J Exp Surg. 2013;30:2709-2710
16. Wang JH, Chen XT, Wen ZS. et al. High Expression of GOLPH3 in Esophageal Squamous Cell Carcinoma Correlates with Poor Prognosis. PLoS One. 2012;7:e45622
17. Zeng Z, Lin H, Zhao X. et al. Overexpression of GOLPH3 promotes proliferation and tumorigenicity in breast cancer via suppression of the FOXO1 transcription factor. Clin Cancer Res. 2012;18:4059-4069
18. Stefano Sechi, Anna Frappaolo, Giorgio Belloni. et al. The multiple cellular functions of the oncoprotein Golgi phosphoprotein 3. Oncotarget. 2015;6:3493-3506
19. White BD, Chien AJ, Dawson DW. Dysregulation of Wnt/β-catenin signaling in gastrointestinal cancers. Gastroenterology. 2012;142:219-232
20. Chen YG, Li Z, Wang XF. Where PI3K/Akt meets Smads:the crosstalk determines human embryonic stem cell fate. Cell Stem Cell. 2012;10:231-232
21. Bugarcic A, Zhe Y, Kerr MC, Griffin J, Collins BM, Teasdale RD. Vps26A and Vps26B subunits define distinct retromer complexes. Traffic. 2011;12:1759-1773
22. Belenkaya TY, Wu Y, Tang X. et al. The retromer complex influences Wnt secretion by recycling wntless from endosomes to the trans-Golgi network. Dev Cell. 2008;14:120-131
23. Port F, Kuster M, Herr P. et al. Wingless secretion promotes and requires retromer-dependent cycling of Wntless. Nat Cell Biol. 2008;10:178-185
Author contact
![]() Corresponding author: Cheng-Zhi Qiu, Department of General Surgery, the Second Affiliated Hospital of Fujian Medical University, Quanzhou 362000, Fujian Province, China. qchengzhicom.
Corresponding author: Cheng-Zhi Qiu, Department of General Surgery, the Second Affiliated Hospital of Fujian Medical University, Quanzhou 362000, Fujian Province, China. qchengzhicom.
Citation styles
APA
Qiu, C.Z., Wang, M.Z., Yu, W.S., Guo, Y.T., Wang, C.X., Yang, X.F. (2016). Correlation of GOLPH3 Gene with Wnt Signaling Pathway in Human Colon Cancer Cells. Journal of Cancer, 7(8), 928-934. https://doi.org/10.7150/jca.13968.
ACS
Qiu, C.Z.; Wang, M.Z.; Yu, W.S.; Guo, Y.T.; Wang, C.X.; Yang, X.F. Correlation of GOLPH3 Gene with Wnt Signaling Pathway in Human Colon Cancer Cells. J. Cancer 2016, 7 (8), 928-934. DOI: 10.7150/jca.13968.
NLM
Qiu CZ, Wang MZ, Yu WS, Guo YT, Wang CX, Yang XF. Correlation of GOLPH3 Gene with Wnt Signaling Pathway in Human Colon Cancer Cells. J Cancer 2016; 7(8):928-934. doi:10.7150/jca.13968. https://www.jcancer.org/v07p0928.htm
CSE
Qiu CZ, Wang MZ, Yu WS, Guo YT, Wang CX, Yang XF. 2016. Correlation of GOLPH3 Gene with Wnt Signaling Pathway in Human Colon Cancer Cells. J Cancer. 7(8):928-934.
This is an open access article distributed under the terms of the Creative Commons Attribution (CC BY-NC) License. See http://ivyspring.com/terms for full terms and conditions.