Journal of Cancer
ISSN: 1837-9664
3.2
Impact Factor
ISSN: 1837-9664

 Global reach, higher impact
J Cancer 2015; 6(6):490-501. doi:10.7150/jca.8213 This issue Cite
Research Paper
Reconstitution of the ERG Gene Expression Network Reveals New Biomarkers and Therapeutic Targets in ERG Positive Prostate Tumors
Alexey Dubovenko1 ![]() , Tatiana Serebryiskaya1, Yuri Nikolsky1, Tatiana Nikolskaya2, Ally Perlina1, Lellean JeBailey3, Svetlana Bureeva1, Shilpa Katta4, Shiv Srivastava4, Albert Dobi4, Tatiana Khasanova5
, Tatiana Serebryiskaya1, Yuri Nikolsky1, Tatiana Nikolskaya2, Ally Perlina1, Lellean JeBailey3, Svetlana Bureeva1, Shilpa Katta4, Shiv Srivastava4, Albert Dobi4, Tatiana Khasanova5
1. Thomson Reuters, IP & Science, 5901 Priestly Dr., 200, Carlsbad, CA 92008, USA;
2. 29608 Via Rancheros, Fallbrook, CA 92028, USA;
3. Novartis Institute for Biomedical Research, 250 Massachusets Ave, Cambridge, MA, USA;
4. Center for Prostate Cancer Research, Department of Surgery, Uniformed Services University of the Health Sciences, Bethesda, MD 20814, USA;
5. Rancho Biosciences, PO Box 7208, Rancho Santa Fe, CA, 92067, USA.
Published 2015-4-1
Citation:
Dubovenko A, Serebryiskaya T, Nikolsky Y, Nikolskaya T, Perlina A, JeBailey L, Bureeva S, Katta S, Srivastava S, Dobi A, Khasanova T. Reconstitution of the ERG Gene Expression Network Reveals New Biomarkers and Therapeutic Targets in ERG Positive Prostate Tumors. J Cancer 2015; 6(6):490-501. doi:10.7150/jca.8213. https://www.jcancer.org/v06p0490.htm
Other stylesAbstract
Background: Despite a growing number of studies evaluating cancer of prostate (CaP) specific gene alterations, oncogenic activation of the ETS Related Gene (ERG) by gene fusions remains the most validated cancer gene alteration in CaP. Prevalent gene fusions have been described between the ERG gene and promoter upstream sequences of androgen-inducible genes, predominantly TMPRSS2 (transmembrane protease serine 2). Despite the extensive evaluations of ERG genomic rearrangements, fusion transcripts and the ERG oncoprotein, the prognostic value of ERG remains to be better understood. Using gene expression dataset from matched prostate tumor and normal epithelial cells from an 80 GeneChip experiment examining 40 tumors and their matching normal pairs in 40 patients with known ERG status, we conducted a cancer signaling-focused functional analysis of prostatic carcinoma representing moderate and aggressive cancers stratified by ERG expression.
Results: In the present study of matched pairs of laser capture microdissected normal epithelial cells and well-to-moderately differentiated tumor epithelial cells with known ERG gene expression status from 20 patients with localized prostate cancer, we have discovered novel ERG associated biochemical networks.
Conclusions: Using causal network reconstruction methods, we have identified three major signaling pathways related to MAPK/PI3K cascade that may indeed contribute synergistically to the ERG dependent tumor development. Moreover, the key components of these pathways have potential as biomarkers and therapeutic target for ERG positive prostate tumors.
Keywords: Prostate cancer, differentiation status, TMPRSS2-ERG fusion.
Background
Cancer of the prostate (CaP) is the second leading cause of cancer related death in men in the USA with estimated 238,590 new cases and 29,720 deaths in 2013 [1]. Although significant progress has been made in the early detection and treatment of the organ confined CaP, better understanding of the cancer biology is essential in addressing current challenges related to the development of more precise diagnostic and prognostic biomarkers and rational therapy targets. [2] Recent investigations have been providing new insights into common genomic alterations in CaP. [3] The driver genetic alterations and molecular mechanisms contributing to CaP onset and progression need to be better understood. [4-8] Despite a growing number of studies evaluating CaP specific gene alterations, oncogenic activation of the ETS Related Gene (ERG) by gene fusions remains the most validated cancer gene alteration in CaP. [9-11]
Evaluations of the CaP epithelial transcriptome revealed overexpression of the ERG mRNA in prostate cancer cells. [12-14] Further, our quantitative evaluations of ERG mRNA expression in laser capture micro-dissected (LCM) matched benign and tumor cells of 114 patients, identified ERG overexpression in over two thirds of patients. [14] Prevalent gene fusions have been described between the ERG gene (or other members of the ETS Family of transcription factors) and promoter upstream sequences of androgen-inducible genes, predominantly TMPRSS2 (transmembrane protease serine 2) and other androgen inducible genes. [15-17] ERG knock-down in TMPRSS2-ERG positive CaP cell culture and xenograft models revealed significantly reduced tumor cell growth. [18] Further, altered ERG expression in cell culture models of CaP resulted in differentiation-associated or invasion-associated gene expression. [18-20]
With the development of ERG monoclonal antibodies, recent reports provided first insights into the detection of the protein products of the ERG gene fusions in CaP. [21, 22] The ERG oncoprotein expression in CaP is highly tumor cell specific (>99%) and concordant (>95%) with the ERG gene fusion status. [23-26] Despite the extensive evaluations of ERG genomic rearrangements, fusion transcripts and now the ERG oncoprotein, the prognostic value of ERG remains to be better understood. [11, 27] Cooperation of ERG with other CaP-associated alterations, primarily the loss of PTEN (phosphatase and tensin homolog) has shown association with the disease progression. [28-33]
Studies have also suggested prognostic implication of the relative abundance of specific TMPRSS-ERG splice variants (full length vs. truncated) in CaP progression. [20, 34] Although, a considerable number of studies have addressed the clinical correlations of the oncogenic activation of ERG, critical pathways affected by ERG remain to be better defined. Since the analysis of pairwise gene interaction of fusion gene networks, including ERG, indicated universal principles in human neoplasia [35], bioinformatic approaches have been used to address the ERG-regulated gene expression signature in CaP. Studies on ERG-associated gene expression patterns revealed signatures of epigenetic reprogramming and elevated expression of WNT-associated and attenuated cell death pathways [36] Association of epigenetic alterations as well as the presence of WNT signature in ERG positive human prostate tumors have been confirmed by several studies [37-39] A functional interface of ERG and C-MYC (v-myc myelocytomatosis viral oncogene homolog (avian)) has also been noted in the regulation prostate epithelial differentiation markers [18] Integrative molecular concept analysis addressing the CaP-associated gene expression signatures have revealed ERG as the most upregulated feature in prostatic adenocarcinoma. These data also highlighted the enrichment of differentially expressed networks of the protein biosynthesis pathway and androgen signaling in the transition from benign to pre-invasive and from localized to metastatic prostate cancer [40]
Using gene expression dataset from matched prostate tumor and normal epithelial cells from 40 patients [14, 18, 41]; we conducted a cancer signaling-focused functional analysis of prostatic carcinoma representing moderate and aggressive cancers stratified by ERG expression. Our findings suggest the activation of MAPK (mitogen activated kinase-like protein) and PI3K (Phosphoinositide 3-kinase) cascades by synergistic actions of several genes (FGF2 (fibroblast growth factor 2), Angiotensin II, Neprilysin, AR (androgen receptor), E2F1 (E2F transcription factor 1), Tcf (T-cell specific factors), and DAN (neuroblastoma, suppression of tumorigenicity 1)) via three major distinctive signaling pathways.
Methods
Selection of Cases, LCM isolation of Tumor and Matching Benign Cells, Detection of ERG
Using our previously reported gene expression dataset (GSE32448) from laser capture micro-dissected matched normal and tumor cells from 40 patients [18, 41]; we performed evaluation of biochemical pathways in ERG positive and ERG negative tumors. Briefly, from a PSA (prostate specific antigen) screened patient group with no prior neoadjuvant treatment, 300 cases were examined under an approved protocol from the Institutional Review Board approval of Walter Reed National Military Medical Center (WRNMMC) and Uniformed Services University of the Health Sciences (USUHS). Following radical prostatectomy frozen tumor tissues were obtained by ex-vivo biopsy of palpable tumors representing mainly index tumors. Prostates were preserved as whole-mounted FFPE fixed specimens. Following the evaluation of all tumor foci in whole-mounted sections, tumor growth pattern (Gleason score) and also the glandular differentiation (differentiation) were recorded in both the FFPE and the matching frozen tissues. We have selected cases representing two extremes from the continuum of prostate cancers. In one group (n=20) cases were selected with Gleason sum 6 (n=11) and 7 (3+4, n=9) and tumors cells with well- to moderately differentiated (WMD) morphology. The laser capture procedure was performed on the single-cell level capturing only cells with well to moderately differentiated morphology from Gleason patter 3. In the second group (n=20) cases with Gleason sum of 8-9 were selected. Single cell resolution of laser capture was directed to cells with PD morphology. Cells were isolated by laser capture microdissection (LCM) (Arcturus Pixel 2) from OCT embedded and H&E stained frozen prostate sections (2000 laser shots per area as described earlier [14, 41-43] The morphological homogeneity was approximately 90% for cancer or benign epithelial cells. As a quality control for tumor or benign epithelial cells ERG, AMACR (alpha-methylacyl-CoA racemase) and PCA3 (prostate cancer antigen 3) transcripts were analyzed by QRT-PCR, confirming the morphological assessment [43] Presence or absence of ERG expression, TMPRSS2-ERG transcripts, and the expression of major ERG splice variants were derived from the previously published data [14, 34, 41] TMPRSS2-ERG fusion junctions (fusion “a, b and/or c”) at mRNA levels was detected in 18 of the 20 samples with WMD tumor cell morphology. TMPRSS2-ERG fusion junction was found only in 9 cases among the samples from PD tumor cells as previously shown [41].
Microarray Expression Profiling and Statistical Analysis
RNA extracted from the LCM benign and malignant epithelial cells and were hybridized to Affymetrix GeneChips (Human Genome U133 Plus 2.0 chip) and processed as decribed [14, 42] Expression profiles in CEL format containing probe intensities corresponding to 80 samples were [NCBI/GEO: GSE32448] processed using R (http://r-project.com/). Additional modules used for data processing, normalization, clustering were obtained from Bioconductor Project (http://www.bioconductor.org) [44]. The initial processing of CEL files was performed using an updated GeneChip Robust Multiarray Averaging (GC-RMA) algorithm with new probe annotations [45, 46] for EntrezGene features provided by Affymetrix (http://brainarray.mbni. med.umich.edu/ Brainarray /DatabaseCustomCDF /genomic_curated_CDF.asp). For the purpose of this study, each set of intensities obtained from EntrezGene microarray analysis is referred to as an “experiment” file.
The data for present study thus consisted of experiments obtained for prostate tumor cells and matched benign prostate cells from the same cases. For each EntrezGene feature the change in gene expression level was calculated by two ways: matched fold changes and mean fold changes. For each matched pair of experiments the change in gene expression level was calculated as the difference between gene expression levels in tumor sample vs. normal sample. This approach takes into account variability in each individual's gene expression pattern. Mean fold changes were computed for each EntrezGene feature as difference between mean expression in case matched samples and mean expression in control samples for each defined comparison groups of samples.
The following datasets were subjected to clustering analysis: (a) full set of 40 cases with Fold-Changes, (b) a set of only WMD tumor cells (Gleason score ≤7), (c) a set of only poor differentiated tumor cells (Gleason score > 7).
Clustering Analysis
Clustering analysis of experiments in a fold change format was performed with Pvclust [47]. This package allows for hierarchical clustering using various algorithms with Multiscale Bootstrap Resampling (MRB). The method is based on resampling of data, and applicable to a large class of problems including hierarchical clustering. In the MRB, we set the gene set size of bootstrap samples to several values. Let N be the original data size, and N' be that for bootstrap samples (N'= N*0.5; 0.6; 0.7; 0.8; 0.9; 1; 1.1; 1.2; 1.3 and 1.4). In our case, N = 18873 EntrezGene features, and N' = 9436, 11323, 13211, 15098, 16985, 18873, 20760, 22647, 24534 and 26422 random EntrezGene features. MRB uses 1000 bootstrap replicates with random N' data sizes. On the basis of constructed bootstrap samples MRB measures the accuracy of defined clusters as p-values, which ranges from 0 to 1. MRB yields Approximatelly Unbiased (AU) p-value for each cluster, a cluster is considered statistically significant if AU p-value < 0.05. High statistical approval of AU p-value usage during cluster analysis is described in [48]. In our work we use standard R-package representation of these p-values, therefore statistically significant range of AU p-values is from 95 to 100 [47].
Clustering analysis was performed with Single Linkage, Complete Linkage, Average Linkage and Centroid Linkage algorithms. To determine the distance between clusters, Euclid metrics was used.
Clustering analysis was performed on a total set of EntrezGene features for all experiments, as well as on partial sets [49] Specifically, 1000, 3000, and 5000 expression profiles with the biggest standard deviations between log2 transformed fold changes of expression level in tumor tissue compared to normal tissue were used for clustering analysis first, and the cluster stability was then tested on a full set of genes (all features found on the investigated Affymetrix platform).
Identification of differentially expressed genes
To identify differentially expressed genes between defined groups of samples, we used Bayesian moderated t-statistics coupled with false discovery rate (FDR) adjustment = 0.05. This test borrows information about gene-wise signal variances across all genes and uses empirical Bayes approach to derive posterior estimates of variance. Formally it shrinks variances towards a pooled estimate, thus increasing statistical power when number of samples is small. Moreover, this test is insensitive to missing data and doesn't require normality of the data [50]
From the lists of differentially expressed genes, the genes (EntrezGene features) were selected based on expression levels: either downregulated or upregulated at least 1.5 mean fold change values.
Functional Analysis
We used the knowledge-based MetaCore 6.7 software package [51] to identify molecular processes that are affected by the gene's products of translation and transcription. MetaCore™ analyzes the global biological network by various algorithms, such as direct interactions, shortest paths, analyze network, transcription regulation, and auto-expand, expand by one interaction, and others. [51] We used transcription regulation algorithm to identify the most overconnected transcription factors in a set of differentially expressed genes in our experimental data and Canonical Pathway modeling to identify canonical pathways enriched with differentially expressed genes from our data.
Transcription regulation algorithm starts building a network by first constructing a smaller network that consists of the initial set of genes of interest and then by adding closest transcription factors (transcription factors that are connected to a gene in a set by “transcription regulation” edge). Then, a separate network is built around every transcription factor, using the Auto Expand algorithm (which gradually expands sub-networks around every transcription factor) while limiting the expansion to the objects from the initial list. The algorithm delivers a list of networks, one per transcription factor.
For every initial object the Canonical Pathway modeling algorithm searches the MetaCore™ Database for all canonical pathways that start at, end at, or pass through that initial object, and builds a network consisting of all objects and links from all such pathways. The set of networks thus obtained is then prioritized by the number of initial objects they contain. If two or more networks contain the same number of the initial objects, they are further prioritized by giving preference to those with the least total number of objects.
Statistically significant network modules were combined for easier visualization of interconnecting processes taking place in prostate tumors with the expression of ERG oncogene.
Enrichment Analysis
A total of four functional ontologies of biological processes were used: GO processes (www.geneontology.org) and three MetaCore ontologies - GeneGo Process Networks Ontology (163 networks of cell processes created from literature curated data), GeneGo Pathway Maps (163 maps of main cellular activation processes, also constructed from annually curated data), Diseases (by Biomarkers) (known biomarkers of various diseases). In all three MetaCore ontologies molecular processes are prioritized based on statistical significance. To identify common molecular-biological processes the Compare Experiments workflow was used. This workflow determines common processes based on the analysis of statistically significant biological processes and expression data for genes participating in these processes. Visualization of generated hypotheses in the form of networks was also performed in MetaCore [51].
Results
In order to evaluate the biological role of elevated ERG expression in prostate tumors with ERG activation, we investigated global expression profiles of prostatectomy specimens from PSA (prostate specific antigen)-screened patients, who had no prior androgen ablation treatment. ERG expression was evaluated in human prostate cancer samples by using Affymetrix oligonucleotide microarrays. The data was generated from quality controlled laser capture microdissected tumor cells (n=40) and matched benign epithelial cells (n=40) from OCT embedded frozen prostate specimens. The specimens were obtained from age and race (Caucasians) matched cases, selected from a cohort of over 300 patients. Table 1 summarizes ERG expression levels in each tumor - normal pair sample. Applying a 1.5X cutoff, ERG overexpression is prevalent in well-to-moderately differentiated tumors (tumors that are associated with lower, ≤7 Gleason score, Table 1): 15 out of 20 well-to-moderately differentiated (WMD) tumors had increased ERG levels vs 6 out of 20 PD samples (p-value = 0.04953, Chi-squared test).
Table 1
Tumor cell differentiation and ERG expression levels in tumor samples. ERG+: samples with overexpressed ERG; ERGn: samples with relative ERG expression changes not exceeding the 1.5X cutoff.
| Patient# | Diff. status | ERG Fold Change value | ERG mRNA | Patient ID | Diff. status | ERG Fold Change value | ERG mRNA | |
|---|---|---|---|---|---|---|---|---|
| 17 | WMD | 16.3 | ERG+ | 31 | PD | 8.9 | ERG+ | |
| 19 | WMD | 15.2 | ERG+ | 28 | PD | 8.7 | ERG+ | |
| 18 | WMD | 12.9 | ERG+ | 26 | PD | 8.6 | ERG+ | |
| 3 | WMD | 12.5 | ERG+ | 24 | PD | 7.9 | ERG+ | |
| 15 | WMD | 10.2 | ERG+ | 33 | PD | 7.6 | ERG+ | |
| 1 | WMD | 9.7 | ERG+ | 37 | PD | 5.4 | ERG+ | |
| 8 | WMD | 9.0 | ERG+ | 40 | PD | 1.5 | ERGn | |
| 4 | WMD | 8.3 | ERG+ | 29 | PD | 1 | ERGn | |
| 5 | WMD | 8.1 | ERG+ | 32 | PD | 1 | ERGn | |
| 16 | WMD | 7.7 | ERG+ | 25 | PD | 1 | ERGn | |
| 10 | WMD | 7.2 | ERG+ | 27 | PD | 1 | ERGn | |
| 13 | WMD | 6.7 | ERG+ | 21 | PD | 1 | ERGn | |
| 14 | WMD | 5.9 | ERG+ | 30 | PD | 1 | ERGn | |
| 11 | WMD | 4.3 | ERG+ | 36 | PD | 1 | ERGn | |
| 6 | WMD | 2.6 | ERG+ | 38 | PD | 1 | ERGn | |
| 7 | WMD | 1.1 | ERGn | 34 | PD | 1 | ERGn | |
| 2 | WMD | 1 | ERGn | 39 | PD | 1 | ERGn | |
| 9 | WMD | 1 | ERGn | 35 | PD | 1 | ERGn | |
| 12 | WMD | 1 | ERGn | 23 | PD | 1 | ERGn | |
| 20 | WMD | 1 | ERGn | 22 | PD | 1 | ERGn |
WMD tumors associate with better overall clinical prognosis (see, for example, [2]). As noted before [41], majority (75%) of WMD samples harbored ERG overexpression. Hierarchical clustering analysis of our dataset may help validate the observation that ERG overexpression is more frequently observed in WMD samples. Thus, clustering analysis was performed with Single Linkage, Complete Linkage, Average Linkage and Centroid Linkage algorithms with multiscale bootstrap resampling (MRB). To determine the distance between clusters, Euclid metrics was used. On the basis of constructed bootstrap samples, MRB measured the accuracy of defined clusters as p-values, which ranged from 0 to100. MRB yielded Approximatelly Unbiased (AU) p-value for each cluster; a cluster was considered statistically significant if AU p-value >95. For clustering analysis, we used a total set of genes, about 20,000 (please refer to Methods for explanation how these genes were determined), as well as sets of 1000, 3000 and 5000 genes with the largest standard deviations between log2 transformed fold changes in normal vs. tumor samples expression profiles.
In the analyzed sets two extremes (well-to-moderately and poorly differentiated (PD)) tumors were equally represented. Clustering of all 40 samples with either full or truncated gene set did not yield clusters that correlated with either an observed differentiation status or ERG expression feature (data not shown). In contrast, when we performed clustering analysis on a set of 20 WMD samples with either a full or any of the truncated set of genes we observed a statistically significant partitioning that correlated with ERG+ and ERG- groups (Figure 1). This correlation was not observed in PD samples likely reflecting progression-associated molecular complexity of PD tumor cells.
Hierarchical clustering analysis confirmed that the set of genes expressed differentially in normal and cancerous tissue, partitioned samples into distinct clusters with ERG expression in WMD and not in PD prostate cancer samples. This result is consistent with several previously reported observations for this dataset [14, 41] indicating that elevated ERG expression in WMD samples suggests for the role of ERG oncogene in early stages of CaP onset.
We next explored the mechanism of ERG overexpression in the subset of WMD cancer samples by building a “causal” model, or network, using differentially expressed genes (DEGs) as the seed nodes and collection of some 400,000 protein-protein interactions in MetaBase™ (Thomson Reuters) as the source of edges [51] DEGs used for causal network construction were identified by comparing expression profiles of ERG-overexpressing, WMD tumor samples with normal tissues from matched patients (Figure 2). A total of 207 genes (for the list, see Addition file 1) with > 1.5 fold change and p-value of differential expression <0.05, were processed for further analysis. However, comparison between ERG positive or ERG negative tumors (regardless of differentiation status) without reference to matched normal epithelial cells did not yield significant enrichment of DEGs to perform further analysis (Additional file 2).
Figure 1
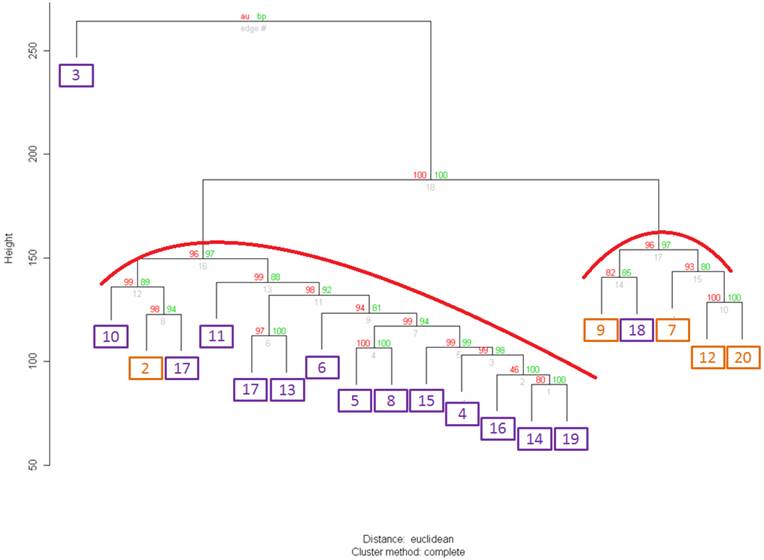
Clustering of 20 samples from well differentiated tumors with the whole set of differentially expressed gene (DEGs). ERGn samples are in orange frames, ERG+ samples are in purple frames. For both clusters Approximately Unbiased (AU) p-value=96. Values on the edges of the clustering are p-values (%). Red values are AU p-values, and green values are Bootstrap Probability values (Explanations about AU and BP values are found on the website http://www.is.titech.ac.jp/~shimo/prog/pvclust/ along with the description of pvclust R package that was used to perform clustering. In brief, BP values are computed by bootstrap resampling and AU values are computed by multiscale bootstrap resampling and thus are considered a better representation of an unbiased p-value for clusters.) Clusters strongly supported by the data have AU values of larger than 95% and are highlighted in red in the Figure.
Figure 2
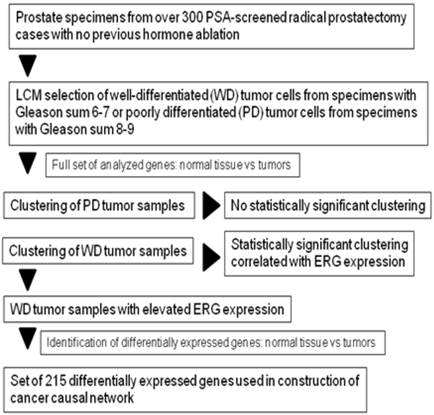
Flowchart of sample selection and DEGs identification for the construction of causal network.
Analysis of key “triggers” and “effectors” [52] in the set of 215 DEGs (“ERG+ dependent genes”) according to MetaCore™ database of protein interactions (Thomson Reuters) suggests the following scenario of progression of normal to a ERG overexpressing cancer cells in the early stages of prostate cancer development (Figure 3). In this context, AR (androgen receptor) drives the unscheduled expression of the TMPRSS2-ERG in CaP cells, resulting in the production of truncated ERG (32 amino terminal amino acids) oncoprotein. The ERG oncoprotein as a transcription factor may then increase the expression of its targets including the activation of C-MYC oncogene1 and TWIST1 (twist basic helix-loop-helix transcription factor 1) that is associated with increased proliferative potential (mean fold change = 3.53; p-value = 6.8e-05). These two transcription factors (TFs) act as coactivators for several TFs such as AR, E2F1 (E2F transcription factor 1), Tcf (Lef) and changing the expression levels of ERG dependent genes.
Network reconstruction method allows us to create hypotheses about further cancer development events (Figure 3 and 4). For example, TWIST1 by cooperation with histone deacetylase HDAC5 (histone deacetylase 5) activates HIF1A (hypoxia inducible factor 1, alpha subunit) [53] transcription factor and induces overexpression of GHR (growth hormone receptor) and Tissue factor. Indeed, our data indicates (see above) that TWIST1 is significantly overexpressed in WMD, ERG+ samples. Increased amount of GHR and Tissue factor may then initiate downstream signal transduction by MAPK and PI3K cascades and cause activation of downstream transcriptional factors. This pathway is shown in bold purple line on Figure 4.
An additional activation of MAPK pathway can possibly be induced due to an increased intercellular concentration of FGF2 (fibroblast growth factor 2) and Angiotensin II. Higher level of FGF2 and Angiotensin II may result from decreased expression of metallopeptidase Neprilysin in tumor cells, observed in this study (Figure 4). In normal process, Neprilysin breaks down signaling peptides FGF2 and Angiotensin II and thus inhibits hyperactivation of MAPK pathway, and, specifically, angiogenesis [54] In addition it has been shown that Angiotensin II serves as an activator for EGF (epidermal growth factor), which is also capable of activating the MAPK pathway [55] (Figure 4, bold beige lines).
Another route of activation that can lead to enhanced AR activity starts with a downregulated oncogene suppressor, DAN (neuroblastoma, suppression of tumorigenicity 1). In normal cellular context this protein is excreted into intercellular space and inhibits signaling peptides of BMP (Bone morphogenic proteins) family. BMPs initially reported to be regulators of bone biology have also been shown to influence other tissues. BMP receptors can phosphorylate transcription factors of SMAD family [56] Activated transcription factors SMAD, in turn, form complexes with CBP (CREB-binding protein) [57] which then can bind with AR and can enhance AR activity [57, 58] (Figure 4, bold green lines).
Overall, Figures 3 and 4 show a model of a cancer self-regulatory circuit that was uncovered by analyzing DEGs in ERG overexpressing WMD prostate tumor cells. Interestingly, we can discern three major pathways (shown in bold green, purple and beige lines on Figure 4) that contribute to the tumor development in the studied samples. In addition to the top-level process of cancer development shown in Figure 4 our newtwork analysis identified specific processes that some of ERG+ dependent genes participate in, thus contributing to the tumorigenesis. First, several ERG+ dependent genes are related to angiogenesis. The key factor in this process is the transcription factor HIF1 (Hypoxia Induced Factor 1). HIF1 may be activated in ERG+ tumors by several complementary pathways: by active MAPK cascade; by covalent modification brought about by histone deacetylases HDAC1 (which in our dataset has increased expresion) or HDAC5 (mediated by TWIST1); and by direct interaction with Angiotensin II, which is turned on by AR or IL-8. These observations may also reflect normal functions ERG in vascular endothelial cells [59-61] Second, activation of a sub-set of phospholipases that regulate arachidonic acid synthesis can be expected in the well-to-moderately defferentiated ERG overexpressing tumors. Phospholipases PLA2G4C and PLA2G7 are found among upregulated ERG+ dependent genes, and in addition, their activity can be increased by MAPK cascade. An observed decreased SFN (14-3-3 sigma) expression (which in normal processes inhibits cell cycle kinase CDK) can lead to accelerated cell cycle and uncontrolled proliferation [62] Third, translation processes can be accelerated by increased expression levels of some ribosomal proteins, translation initiation factor eIF2 and translation elongation factor eEF2, all of which are present in ERG, as well as, in the ERG-downstream C-MYC activated genes.
According to the analyzed data two independent pathways can be envisioned that support ERG+ cancer cell survival - protein folding increase and secretion of surplus products of translation in intercellular space. In ERG+ tumors an increased expression of TAOK3 protein (serine/threonine protein kinase TAO3) was noted, which activates IRE3 (endoplasmic reticulum to nucleus signaling 3) kinase responsible for launching cell survival pathways during unfolded protein response. IRE3 activates transcription factor XBP1 (X-box binding protein 1) which regulates a number of proteins involved in protein folding in endoplasmic reticulum and elimination of protein surplus [63] Further, the increased expression of myosin-6 can cause the secretion of large amounts of newly synthesized proteins, peptides, glycoproteins in intercellular region since myosin-6 forms structures that transport newly formed vacuoles from Golgi apparatus to cell surface through actin filaments [64, 65] Rab-11A protein from GTPase superfamily regulates vacuole transport to cell surface [66] and is overexpressed in most ERG+ samples. Both of the described processes and activated AKT pathway can inhibit apoptosis.
In summary, the analysis of the data on differentially expressed genes in ERG positive, WMD prostate tumor samples with TMPRSS2-ERG fusion reveals the following signature. Our data suggests the activation of MAPK and PI3K cascades by synergistic actions of several genes (FGF2, Angiotensin II, Neprilysin, AR, E2F1, Tcf, and DAN via three major distinctive signaling pathways (Figure 4). The major finding of this study is that an “out of context” expression of ERG in prostate cancer cells may activate processes resembling angiogenesis that may reflect the normal endothelial function of ERG. Further findings include increased proliferation, suppressed apoptosis and increased protein synthesis likely contributing to the overall process through distinct signaling pathways. We thus envision that key kinases from the identified pathways may be considered as therapeutic targets for potential ERG+ tumors.
Discussion
Lack of molecular typing of prostate tumors presents significant challenges in selecting targeted treatment strategies. For patients with localized cancer and low initial PSA levels, expectant management might be a preferred strategy, however, these patients must be distinguished from patients with progressive cancer phenotypes who require aggressive treatment [67] TMPRSS2-ERG fusion, detected in 50 to 70% prostate cancers, has been a subject of extensive evaluations [68-73] In this study we studied WMD subset of prostate tumor samples that had elevated levels of ERG expression in a defined cohort of radical prostatectomy patients with no previous hormone therapy. This type of WMD tumors may present special treatment challenges since typically they are associated with low (≤7) Gleason scores and low PSA levels at initial diagnosis and as such may prompt expectant management of patients. Understanding specific molecular mechanisms of cancer development in these tumors and identification of possible biomarkers and/or treatment targets can help clinicians to stratify patients into different treatment categories.
Figure 3
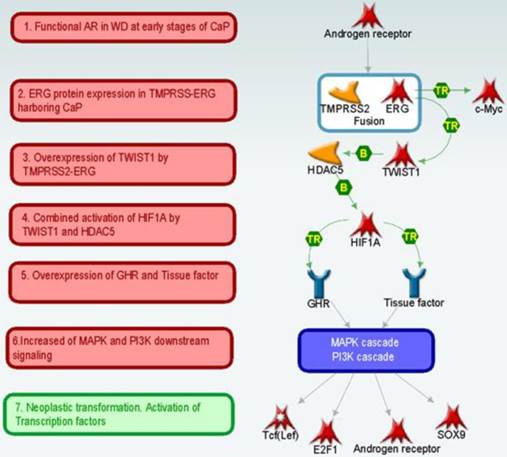
Possible scenario of preinvasive to invasive stages of prostate tumorigenesis.
Figure 4
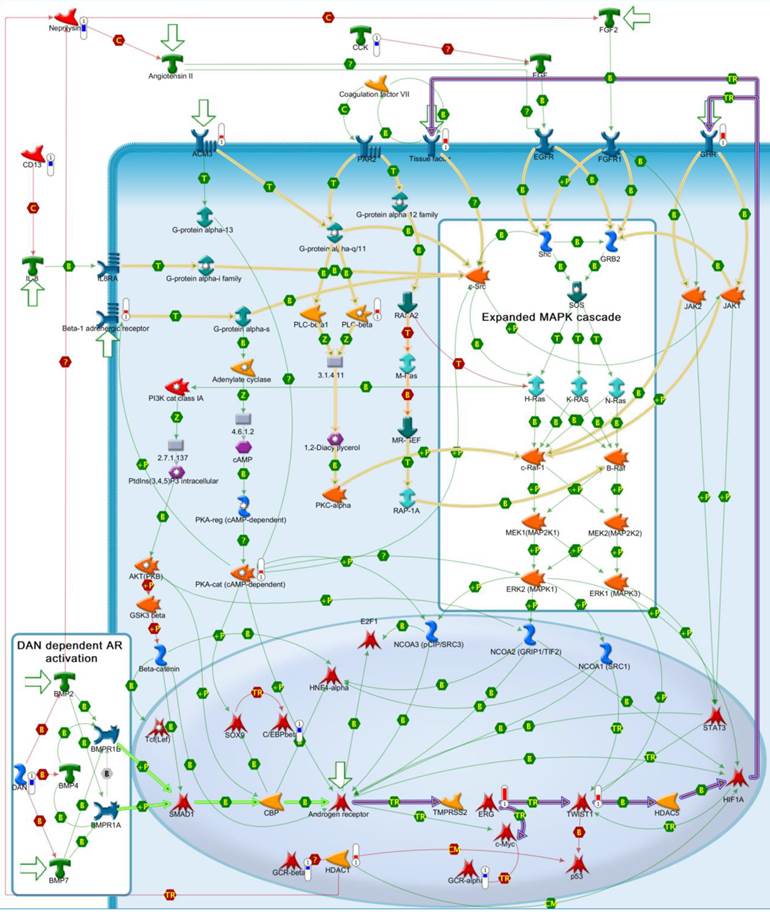
Detailed self-regulation scheme of cancer development in ERG+ well differentiated tumor samples. Thin green links indicate activation interactions. Thin red links indicate inhibition interactions. Bold purple links - key pathway from Fig.3. Bold green links - DAN dependent AR activation. Bold beige links - MAPK cascade activation pathways.  - down regulated ERG+ dependent genes.
  - upregulated ERG+ dependent genes.
  - triggers of the most important pathways.
In the present study, we have identified 215 differentially expressed genes by comparing gene expression profile between ERG positive and ERG negative tumors versus matched normal epithelial cell in the well differentiated group. This gene set was then used for the reconstruction of causal network relying on protein interactions manually curated from literature and algorithms from MetaCore™ (Thomson Reuters). Application of system biology methods to a large set of data allowed an insight to complex interactions and causal dependencies that exist between potential disease biomarkers, transcription factors, key enzymes and other functional proteins represented by the set of differentially expressed genes. [51] These causal relationships can then be easily visualized on a network (such as shown in Figure 4) in the form of distinct pathways, processes and signal transduction routes. Some of the key benefits of visualizing protein interactions on a network constructed from knowledge base of literature curated interactions using well-validated and widely accepted algorithms [51] include ability to assess dependencies, key regulators, auxillary metabolic enzymes, as well as being able to see fine details of individual pathways. For example, some important genes vital to a pathway might have not been detected in a gene expression experiment either due to an experimental design, or due to a lack of expression at the particular timepoint of the experiment, or simply due to statistical constraints placed on the experiment. Our network (Figure 4) shows that HIF1A is an important participant of AR/ERG activation pathway (bold purple lines), but HIF1A was not found among 215 differentially expressed genes in our study. Thus, HIF1A could have been missed if we were to only construct a gene signature from our data without a consideration of functional significance revealed by network reconstruction method.
The causal network we constructed by analyzing the gene expression profiles of well differentiated, ERG-positive tumor samples offers a working hypotheses of the ERG-positive cancer phenotype. It follows from the network analysis that three major pathways leading to cancer development and progression are at play (Figure 4). All three pathways are related to a well-documented and cancer-related MAPK/PI3K cascade, but our network offers finer details on molecular mechanism of the MAPK cascade activation. Androgen-receptor activated ERG→MYC, TWIST1→HIF1A pathway, FGF2→Angiotensin II pathway and AR-activating DAN→SMAD1 pathway work synergistically and interdependently to promote tumorigenesis. A scrutiny of the network along these pathways can also yield a list of potential treatment targets that may be considered. Three major cancer pathways are supplemented by “typical” cancer-associated processes of angiogenesis, cell proliferation, increased translation and apoptosis inhibition.
Supplementary Material
Additional File 1Table listing genes that are differential expressed in well differentiated samples of CaP with ERG-TMPRSS2 fusion in comparison to normal prostate samples of the same patients.
Table listing differential expressed genes counts for different comparisons of experimental groups. For valuable differential expressed gene lists enrichment analysis is shown for pathways and other gene sets.
Conclusions
In the present study of matched pairs of isolated normal epithelial cells and WMD tumor epithelial cells with known ERG gene expression status from 20 patients with localized prostate cancer, we have discovered novel ERG associated biochemical networks. Using causal network reconstruction methods, we have identified three major signaling pathways related to MAPK/PI3K cascade that may indeed contribute synergistically to the ERG dependent tumor development. Moreover, the key components of these pathways have potential as biomarkers and therapeutic target for ERG positive prostate tumors.
Acknowledgements
This research was supported in part by the National Cancer Institute R01CA162383 grant to S.S.
Competing Interests
The authors have declared that no competing interest exists.
References
1. Siegel R, Naishadham D, Jemal A. Cancer statistics, 2012. CA Cancer J Clin. 2012;62:10-29
2. Shen MM, Abate-Shen C. Molecular genetics of prostate cancer: new prospects for old challenges. Genes Dev. 2010;24:1967-2000
3. Mani RS, Chinnaiyan AM. Triggers for genomic rearrangements: insights into genomic, cellular and environmental influences. Nat Rev Genet. 2010;11:819-829
4. Taylor BS, Schultz N, Hieronymus H, Gopalan A, Xiao Y, Carver BS, Arora VK, Kaushik P, Cerami E, Reva B, Antipin Y, Mitsiades N, Landers T, Dolgalev I, Major JE, Wilson M, Socci ND, Lash AE, Heguy A, Eastham JA, Scher HI, Reuter VE, Scardino PT, Sander C, Sawyers CL, Gerald WL. Integrative genomic profiling of human prostate cancer. Cancer Cell. 2010;18:11-22
5. Kumar A, White TA, MacKenzie AP, Clegg N, Lee C, Dumpit RF, Coleman I, Ng SB, Salipante SJ, Rieder MJ, Nickerson DA, Corey E, Lange PH, Morrissey C, Vessella RL, Nelson PS, Shendure J. Exome sequencing identifies a spectrum of mutation frequencies in advanced and lethal prostate cancers. Proc Natl Acad Sci U S A. 2011;108:17087-17092
6. Berger MF, Lawrence MS, Demichelis F, Drier Y, Cibulskis K, Sivachenko AY, Sboner A, Esgueva R, Pflueger D, Sougnez C, Onofrio R, Carter SL, Park K, Habegger L, Ambrogio L, Fennell T, Parkin M, Saksena G, Voet D, Ramos AH, Pugh TJ, Wilkinson J, Fisher S, Winckler W, Mahan S, Ardlie K, Baldwin J, Simons JW, Kitabayashi N, MacDonald TY, Kantoff PW, Chin L, Gabriel SB, Gerstein MB, Golub TR, Meyerson M, Tewari A, Lander ES, Getz G, Rubin MA, Garraway LA. The genomic complexity of primary human prostate cancer. Nature. 2011;470:214-220
7. Grasso CS, Wu YM, Robinson DR, Cao X, Dhanasekaran SM, Khan AP, Quist MJ, Jing X, Lonigro RJ, Brenner JC, Asangani IA, Ateeq B, Chun SY, Siddiqui J, Sam L, Anstett M, Mehra R, Prensner JR, Palanisamy N, Ryslik GA, Vandin F, Raphael BJ, Kunju LP, Rhodes DR, Pienta KJ, Chinnaiyan AM, Tomlins SA. The mutational landscape of lethal castration-resistant prostate cancer. Nature. 2012;487:239-243
8. Barbieri CE, Baca SC, Lawrence MS, Demichelis F, Blattner M, Theurillat JP, White TA, Stojanov P, Van Allen E, Stransky N, Nickerson E, Chae SS, Boysen G, Auclair D, Onofrio RC, Park K, Kitabayashi N, MacDonald TY, Sheikh K, Vuong T, Guiducci C, Cibulskis K, Sivachenko A, Carter SL, Saksena G, Voet D, Hussain WM, Ramos AH, Winckler W, Redman MC, Ardlie K, Tewari AK, Mosquera JM, Rupp N, Wild PJ, Moch H, Morrissey C, Nelson PS, Kantoff PW, Gabriel SB, Golub TR, Meyerson M, Lander ES, Getz G, Rubin MA, Garraway LA. Exome sequencing identifies recurrent SPOP, FOXA1 and MED12 mutations in prostate cancer. Nat Genet. 2012;44:685-689
9. Sreenath TL, Dobi A, Petrovics G, Srivastava S. Oncogenic activation of ERG: A predominant mechanism in prostate cancer. J Carcinog. 2011;10:37
10. Rubin MA, Maher CA, Chinnaiyan AM. Common gene rearrangements in prostate cancer. J Clin Oncol. 2011;29:3659-3668
11. Rosen P, Sesterhenn IA, Brassell SA, McLeod DG, Srivastava S, Dobi A. Clinical potential of the ERG oncoprotein in prostate cancer. Nat Rev Urol. 2012;9:131-137
12. Ernst T, Hergenhahn M, Kenzelmann M, Cohen CD, Bonrouhi M, Weninger A, Klaren R, Grone EF, Wiesel M, Gudemann C, Kuster J, Schott W, Staehler G, Kretzler M, Hollstein M, Grone HJ. Decrease and gain of gene expression are equally discriminatory markers for prostate carcinoma: a gene expression analysis on total and microdissected prostate tissue. Am J Pathol. 2002;160:2169-2180
13. Vanaja DK, Cheville JC, Iturria SJ, Young CY. Transcriptional silencing of zinc finger protein 185 identified by expression profiling is associated with prostate cancer progression. Cancer Res. 2003;63:3877-3882
14. Petrovics G, Liu A, Shaheduzzaman S, Furusato B, Sun C, Chen Y, Nau M, Ravindranath L, Dobi A, Srikantan V, Sesterhenn IA, McLeod DG, Vahey M, Moul JW, Srivastava S. Frequent overexpression of ETS-related gene-1 (ERG1) in prostate cancer transcriptome. Oncogene. 2005;24:3847-3852
15. Tomlins SA, Rhodes DR, Perner S, Dhanasekaran SM, Mehra R, Sun XW, Varambally S, Cao X, Tchinda J, Kuefer R, Lee C, Montie JE, Shah RB, Pienta KJ, Rubin MA, Chinnaiyan AM. Recurrent fusion of TMPRSS2 and ETS transcription factor genes in prostate cancer. Science. 2005;310:644-648
16. Kumar-Sinha C, Tomlins SA, Chinnaiyan AM. Recurrent gene fusions in prostate cancer. Nat Rev Cancer. 2008;8:497-511
17. Pflueger D, Rickman DS, Sboner A, Perner S, LaFargue CJ, Svensson MA, Moss BJ, Kitabayashi N, Pan Y, de la Taille A, Kuefer R, Tewari AK, Demichelis F, Chee MS, Gerstein MB, Rubin MA. N-myc downstream regulated gene 1 (NDRG1) is fused to ERG in prostate cancer. Neoplasia. 2009;11:804-811
18. Sun C, Dobi A, Mohamed A, Li H, Thangapazham RL, Furusato B, Shaheduzzaman S, Tan SH, Vaidyanathan G, Whitman E, Hawksworth DJ, Chen Y, Nau M, Patel V, Vahey M, Gutkind JS, Sreenath T, Petrovics G, Sesterhenn IA, McLeod DG, Srivastava S. TMPRSS2-ERG fusion, a common genomic alteration in prostate cancer activates C-MYC and abrogates prostate epithelial differentiation. Oncogene. 2008;27:5348-5353
19. Tomlins SA, Laxman B, Varambally S, Cao X, Yu J, Helgeson BE, Cao Q, Prensner JR, Rubin MA, Shah RB, Mehra R, Chinnaiyan AM. Role of the TMPRSS2-ERG gene fusion in prostate cancer. Neoplasia. 2008;10:177-188
20. Wang J, Cai Y, Yu W, Ren C, Spencer DM, Ittmann M. Pleiotropic biological activities of alternatively spliced TMPRSS2/ERG fusion gene transcripts. Cancer Res. 2008;68:8516-8524
21. Furusato B, Tan SH, Young D, Dobi A, Sun C, Mohamed AA, Thangapazham R, Chen Y, McMaster G, Sreenath T, Petrovics G, McLeod DG, Srivastava S, Sesterhenn IA. ERG oncoprotein expression in prostate cancer: clonal progression of ERG-positive tumor cells and potential for ERG-based stratification. Prostate Cancer Prostatic Dis. 2010;13:228-237
22. Park K, Tomlins SA, Mudaliar KM, Chiu YL, Esgueva R, Mehra R, Suleman K, Varambally S, Brenner JC, MacDonald T, Srivastava A, Tewari AK, Sathyanarayana U, Nagy D, Pestano G, Kunju LP, Demichelis F, Chinnaiyan AM, Rubin MA. Antibody-based detection of ERG rearrangement-positive prostate cancer. Neoplasia. 2010;12:590-598
23. Chaux A, Albadine R, Toubaji A, Hicks J, Meeker A, Platz EA, De Marzo AM, Netto GJ. Immunohistochemistry for ERG expression as a surrogate for TMPRSS2-ERG fusion detection in prostatic adenocarcinomas. Am J Surg Pathol. 2011;35:1014-1020
24. Falzarano SM, Zhou M, Carver P, Tsuzuki T, Simmerman K, He H, Magi-Galluzzi C. ERG gene rearrangement status in prostate cancer detected by immunohistochemistry. Virchows Arch. 2011;459:441-447
25. Minner S, Enodien M, Sirma H, Luebke AM, Krohn A, Mayer PS, Simon R, Tennstedt P, Muller J, Scholz L, Brase JC, Liu AY, Schluter H, Pantel K, Schumacher U, Bokemeyer C, Steuber T, Graefen M, Sauter G, Schlomm T. ERG status is unrelated to PSA recurrence in radically operated prostate cancer in the absence of antihormonal therapy. Clin Cancer Res. 2011;17:5878-5888
26. Braun M, Goltz D, Shaikhibrahim Z, Vogel W, Bohm D, Scheble V, Sotlar K, Fend F, Tan SH, Dobi A, Kristiansen G, Wernert N, Perner S. ERG protein expression and genomic rearrangement status in primary and metastatic prostate cancer--a comparative study of two monoclonal antibodies. Prostate Cancer Prostatic Dis. 2012;15:165-169
27. Clark JP, Cooper CS. ETS gene fusions in prostate cancer. Nat Rev Urol. 2009;6:429-439
28. King JC, Xu J, Wongvipat J, Hieronymus H, Carver BS, Leung DH, Taylor BS, Sander C, Cardiff RD, Couto SS, Gerald WL, Sawyers CL. Cooperativity of TMPRSS2-ERG with PI3-kinase pathway activation in prostate oncogenesis. Nat Genet. 2009;41:524-526
29. Carver BS, Tran J, Gopalan A, Chen Z, Shaikh S, Carracedo A, Alimonti A, Nardella C, Varmeh S, Scardino PT, Cordon-Cardo C, Gerald W, Pandolfi PP. Aberrant ERG expression cooperates with loss of PTEN to promote cancer progression in the prostate. Nat Genet. 2009;41:619-624
30. Zong Y, Xin L, Goldstein AS, Lawson DA, Teitell MA, Witte ON. ETS family transcription factors collaborate with alternative signaling pathways to induce carcinoma from adult murine prostate cells. Proc Natl Acad Sci U S A. 2009;106:12465-12470
31. Wang Q, Li W, Zhang Y, Yuan X, Xu K, Yu J, Chen Z, Beroukhim R, Wang H, Lupien M, Wu T, Regan MM, Meyer CA, Carroll JS, Manrai AK, Janne OA, Balk SP, Mehra R, Han B, Chinnaiyan AM, Rubin MA, True L, Fiorentino M, Fiore C, Loda M, Kantoff PW, Liu XS, Brown M. Androgen receptor regulates a distinct transcription program in androgen-independent prostate cancer. Cell. 2009;138:245-256
32. Reid AH, Attard G, Ambroisine L, Fisher G, Kovacs G, Brewer D, Clark J, Flohr P, Edwards S, Berney DM, Foster CS, Fletcher A, Gerald WL, Moller H, Reuter VE, Scardino PT, Cuzick J, de Bono JS, Cooper CS. Molecular characterisation of ERG, ETV1 and PTEN gene loci identifies patients at low and high risk of death from prostate cancer. Br J Cancer. 2010;102:678-684
33. Bismar TA, Yoshimoto M, Vollmer RT, Duan Q, Firszt M, Corcos J, Squire JA. PTEN genomic deletion is an early event associated with ERG gene rearrangements in prostate cancer. BJU Int. 2011;107:477-485
34. Hu Y, Dobi A, Sreenath T, Cook C, Tadase AY, Ravindranath L, Cullen J, Furusato B, Chen Y, Thangapazham RL, Mohamed A, Sun C, Sesterhenn IA, McLeod DG, Petrovics G, Srivastava S. Delineation of TMPRSS2-ERG splice variants in prostate cancer. Clin Cancer Res. 2008;14:4719-4725
35. Hoglund M, Frigyesi A, Mitelman F. A gene fusion network in human neoplasia. Oncogene. 2006;25:2674-2678
36. Iljin K, Wolf M, Edgren H, Gupta S, Kilpinen S, Skotheim RI, Peltola M, Smit F, Verhaegh G, Schalken J, Nees M, Kallioniemi O. TMPRSS2 fusions with oncogenic ETS factors in prostate cancer involve unbalanced genomic rearrangements and are associated with HDAC1 and epigenetic reprogramming. Cancer Res. 2006;66:10242-10246
37. Kunderfranco P, Mello-Grand M, Cangemi R, Pellini S, Mensah A, Albertini V, Malek A, Chiorino G, Catapano CV, Carbone GM. ETS transcription factors control transcription of EZH2 and epigenetic silencing of the tumor suppressor gene Nkx3.1 in prostate cancer. PLoS One. 2010;5:e10547
38. Yu J, Mani RS, Cao Q, Brenner CJ, Cao X, Wang X, Wu L, Li J, Hu M, Gong Y, Cheng H, Laxman B, Vellaichamy A, Shankar S, Li Y, Dhanasekaran SM, Morey R, Barrette T, Lonigro RJ, Tomlins SA, Varambally S, Qin ZS, Chinnaiyan AM. An integrated network of androgen receptor, polycomb, and TMPRSS2-ERG gene fusions in prostate cancer progression. Cancer Cell. 2010;17:443-454
39. Gupta S, Iljin K, Sara H, Mpindi JP, Mirtti T, Vainio P, Rantala J, Alanen K, Nees M, Kallioniemi O. FZD4 as a mediator of ERG oncogene-induced WNT signaling and epithelial-to-mesenchymal transition in human prostate cancer cells. Cancer Res. 2010;70:6735-6745
40. Tomlins SA, Mehra R, Rhodes DR, Cao X, Wang L, Dhanasekaran SM, Kalyana-Sundaram S, Wei JT, Rubin MA, Pienta KJ, Shah RB, Chinnaiyan AM. Integrative molecular concept modeling of prostate cancer progression. Nat Genet. 2007;39:41-51
41. Dobi A FB, Shaheduzzaman S, Chen Y, Vahey M, Nydam T, Sesterhenn IG, McLeod D, Petrovics G, Srivastava S. ERG Expression Levels in Prostate Tumors Reflect Functional Status of the Androgen Receptor (AR) as a Consequence of Fusion of ERG with AR Regulated Gene Promoters. The Open Cancer Journal. 2010;3:101-108
42. Shaheduzzaman S, Vishwanath A, Furusato B, Cullen J, Chen Y, Banez L, Nau M, Ravindranath L, Kim KH, Mohammed A, Ehrich M, Srikantan V, Sesterhenn IA, McLeod D, Vahey M, Petrovics G, Dobi A, Srivastava S. Silencing of Lactotransferrin expression by methylation in prostate cancer progression. Cancer Biol Ther. 2007;6:1088-1095
43. Sharad S, Srivastava A, Ravulapalli S, Parker P, Chen Y, Li H, Petrovics G, Dobi A. Prostate cancer gene expression signature of patients with high body mass index. Prostate Cancer Prostatic Dis. 2011;14:22-29
44. Gentleman RC, Carey VJ, Bates DM, Bolstad B, Dettling M, Dudoit S, Ellis B, Gautier L, Ge Y, Gentry J, Hornik K, Hothorn T, Huber W, Iacus S, Irizarry R, Leisch F, Li C, Maechler M, Rossini AJ, Sawitzki G, Smith C, Smyth G, Tierney L, Yang JY, Zhang J. Bioconductor: open software development for computational biology and bioinformatics. Genome Biol. 2004;5:R80
45. Wu Z IR, Gentleman R, Martinez-Murillo F, Spencer F. A Model-Based Background Adjustment for Oligonucleotide Expression Arrays. Journal of the American Statistical Association. 2004;99:909-917
46. Dai M, Wang P, Boyd AD, Kostov G, Athey B, Jones EG, Bunney WE, Myers RM, Speed TP, Akil H, Watson SJ, Meng F. Evolving gene/transcript definitions significantly alter the interpretation of GeneChip data. Nucleic Acids Res. 2005;33:e175
47. Suzuki R, Shimodaira H. Pvclust: an R package for assessing the uncertainty in hierarchical clustering. Bioinformatics. 2006;22:1540-1542
48. Shimodaira H. Approximately unbiased tests of regions using multistep-multiscale bootstrap resampling. Annals of Statistics. 2004;32:2616-2641
49. Kerr G, Ruskin HJ, Crane M, Doolan P. Techniques for clustering gene expression data. Comput Biol Med. 2008;38:283-293
50. Smyth GK. Linear models and empirical bayes methods for assessing differential expression in microarray experiments. Stat Appl Genet Mol Biol. 2004;3:Article3
51. Nikolsky Y, Kirillov E, Zuev R, Rakhmatulin E, Nikolskaya T. Functional analysis of OMICs data and small molecule compounds in an integrated "knowledge-based" platform. Methods Mol Biol. 2009;563:177-196
52. Shi W, Bessarabova M, Dosymbekov D, Dezso Z, Nikolskaya T, Dudoladova M, Serebryiskaya T, Bugrim A, Guryanov A, Brennan RJ, Shah R, Dopazo J, Chen M, Deng Y, Shi T, Jurman G, Furlanello C, Thomas RS, Corton JC, Tong W, Shi L, Nikolsky Y. Functional analysis of multiple genomic signatures demonstrates that classification algorithms choose phenotype-related genes. Pharmacogenomics J. 2010;10:310-323
53. Seo HW, Kim EJ, Na H, Lee MO. Transcriptional activation of hypoxia-inducible factor-1alpha by HDAC4 and HDAC5 involves differential recruitment of p300 and FIH-1. FEBS Lett. 2009;583:55-60
54. Goodman OB Jr, Febbraio M, Simantov R, Zheng R, Shen R, Silverstein RL, Nanus DM. Neprilysin inhibits angiogenesis via proteolysis of fibroblast growth factor-2. J Biol Chem. 2006;281:33597-33605
55. Li X, Lee JW, Graves LM, Earp HS. Angiotensin II stimulates ERK via two pathways in epithelial cells: protein kinase C suppresses a G-protein coupled receptor-EGF receptor transactivation pathway. EMBO J. 1998;17:2574-2583
56. Derynck R, Zhang YE. Smad-dependent and Smad-independent pathways in TGF-beta family signalling. Nature. 2003;425:577-584
57. Fronsdal K, Engedal N, Slagsvold T, Saatcioglu F. CREB binding protein is a coactivator for the androgen receptor and mediates cross-talk with AP-1. J Biol Chem. 1998;273:31853-31859
58. Aarnisalo P, Palvimo JJ, Janne OA. CREB-binding protein in androgen receptor-mediated signaling. Proc Natl Acad Sci U S A. 1998;95:2122-2127
59. Mohamed AA, Tan SH, Mikhalkevich N, Ponniah S, Vasioukhin V, Bieberich CJ, Sesterhenn IA, Dobi A, Srivastava S, Sreenath TL. Ets family protein, erg expression in developing and adult mouse tissues by a highly specific monoclonal antibody. J Cancer. 2010;1:197-208
60. Miettinen M, Wang ZF, Paetau A, Tan SH, Dobi A, Srivastava S, Sesterhenn I. ERG transcription factor as an immunohistochemical marker for vascular endothelial tumors and prostatic carcinoma. Am J Surg Pathol. 2011;35:432-441
61. Nikolova-Krstevski V, Yuan L, Le Bras A, Vijayaraj P, Kondo M, Gebauer I, Bhasin M, Carman CV, Oettgen P. ERG is required for the differentiation of embryonic stem cells along the endothelial lineage. BMC Dev Biol. 2009;9:72
62. Dalal SN, Yaffe MB, DeCaprio JA. 14-3-3 family members act coordinately to regulate mitotic progression. Cell Cycle. 2004;3:672-677
63. Bernales S, Papa FR, Walter P. Intracellular signaling by the unfolded protein response. Annu Rev Cell Dev Biol. 2006;22:487-508
64. Sahlender DA, Roberts RC, Arden SD, Spudich G, Taylor MJ, Luzio JP, Kendrick-Jones J, Buss F. Optineurin links myosin VI to the Golgi complex and is involved in Golgi organization and exocytosis. J Cell Biol. 2005;169:285-295
65. Au JS, Puri C, Ihrke G, Kendrick-Jones J, Buss F. Myosin VI is required for sorting of AP-1B-dependent cargo to the basolateral domain in polarized MDCK cells. J Cell Biol. 2007;177:103-114
66. Hales CM, Griner R, Hobdy-Henderson KC, Dorn MC, Hardy D, Kumar R, Navarre J, Chan EK, Lapierre LA, Goldenring JR. Identification and characterization of a family of Rab11-interacting proteins. J Biol Chem. 2001;276:39067-39075
67. Bill-Axelson A, Holmberg L, Ruutu M, Haggman M, Andersson SO, Bratell S, Spangberg A, Busch C, Nordling S, Garmo H, Palmgren J, Adami HO, Norlen BJ, Johansson JE. Radical prostatectomy versus watchful waiting in early prostate cancer. N Engl J Med. 2005;352:1977-1984
68. Wang J, Cai Y, Ren C, Ittmann M. Expression of variant TMPRSS2/ERG fusion messenger RNAs is associated with aggressive prostate cancer. Cancer Res. 2006;66:8347-8351
69. Mehra R, Tomlins SA, Shen R, Nadeem O, Wang L, Wei JT, Pienta KJ, Ghosh D, Rubin MA, Chinnaiyan AM, Shah RB. Comprehensive assessment of TMPRSS2 and ETS family gene aberrations in clinically localized prostate cancer. Mod Pathol. 2007;20:538-544
70. Demichelis F, Fall K, Perner S, Andren O, Schmidt F, Setlur SR, Hoshida Y, Mosquera JM, Pawitan Y, Lee C, Adami HO, Mucci LA, Kantoff PW, Andersson SO, Chinnaiyan AM, Johansson JE, Rubin MA. TMPRSS2:ERG gene fusion associated with lethal prostate cancer in a watchful waiting cohort. Oncogene. 2007;26:4596-4599
71. Fine SW, Gopalan A, Leversha MA, Al-Ahmadie HA, Tickoo SK, Zhou Q, Satagopan JM, Scardino PT, Gerald WL, Reuter VE. TMPRSS2-ERG gene fusion is associated with low Gleason scores and not with high-grade morphological features. Mod Pathol. 2010;23:1325-1333
72. Leinonen KA, Tolonen TT, Bracken H, Stenman UH, Tammela TL, Saramaki OR, Visakorpi T. Association of SPINK1 expression and TMPRSS2:ERG fusion with prognosis in endocrine-treated prostate cancer. Clin Cancer Res. 2010;16:2845-2851
73. Hermans KG, Boormans JL, Gasi D, van Leenders GJ, Jenster G, Verhagen PC, Trapman J. Overexpression of prostate-specific TMPRSS2(exon 0)-ERG fusion transcripts corresponds with favorable prognosis of prostate cancer. Clin Cancer Res. 2009;15:6398-6403
Footnotes
1
C-MYC is overexpressed in 9/15 ERG+ well differentiated tumor samples. p-Value for c-Myc is only 0.28 and because of our stringent statistical requirements it is not highlighted on network in Figure 4. However, indirect evidence suggests that c-Myc plays a role in the CaP pathogenesis: scrutiny of the network in Figure 4 reveals that a glucocorticoid receptor alpha, located directly downstream of c-Myc and negatively regulated by it, is underexpressed in our set of samples
Author contact
![]() Corresponding author: aleksey.dubovenkocom.
Corresponding author: aleksey.dubovenkocom.
Citation styles
APA
Dubovenko, A., Serebryiskaya, T., Nikolsky, Y., Nikolskaya, T., Perlina, A., JeBailey, L., Bureeva, S., Katta, S., Srivastava, S., Dobi, A., Khasanova, T. (2015). Reconstitution of the ERG Gene Expression Network Reveals New Biomarkers and Therapeutic Targets in ERG Positive Prostate Tumors. Journal of Cancer, 6(6), 490-501. https://doi.org/10.7150/jca.8213.
ACS
Dubovenko, A.; Serebryiskaya, T.; Nikolsky, Y.; Nikolskaya, T.; Perlina, A.; JeBailey, L.; Bureeva, S.; Katta, S.; Srivastava, S.; Dobi, A.; Khasanova, T. Reconstitution of the ERG Gene Expression Network Reveals New Biomarkers and Therapeutic Targets in ERG Positive Prostate Tumors. J. Cancer 2015, 6 (6), 490-501. DOI: 10.7150/jca.8213.
NLM
Dubovenko A, Serebryiskaya T, Nikolsky Y, Nikolskaya T, Perlina A, JeBailey L, Bureeva S, Katta S, Srivastava S, Dobi A, Khasanova T. Reconstitution of the ERG Gene Expression Network Reveals New Biomarkers and Therapeutic Targets in ERG Positive Prostate Tumors. J Cancer 2015; 6(6):490-501. doi:10.7150/jca.8213. https://www.jcancer.org/v06p0490.htm
CSE
Dubovenko A, Serebryiskaya T, Nikolsky Y, Nikolskaya T, Perlina A, JeBailey L, Bureeva S, Katta S, Srivastava S, Dobi A, Khasanova T. 2015. Reconstitution of the ERG Gene Expression Network Reveals New Biomarkers and Therapeutic Targets in ERG Positive Prostate Tumors. J Cancer. 6(6):490-501.
This is an open access article distributed under the terms of the Creative Commons Attribution (CC BY-NC) License. See http://ivyspring.com/terms for full terms and conditions.