Journal of Cancer
ISSN: 1837-9664
3.2
Impact Factor
ISSN: 1837-9664

 Global reach, higher impact
J Cancer 2015; 6(2):151-159. doi:10.7150/jca.10419 This issue Cite
Research Paper
Effects of Mitochondrial Translocation of Telomerase on Drug Resistance in Hepatocellular Carcinoma Cells
Jing Yan*, Yuan Zhou*, DaiXing Chen, LiLi Li, Xin Yang, Yang You, Xianlong Ling ![]()
Department of Gastroenterology, Xinqiao Hospital, Third Military Medical University, Chongqing400037, China.
*Joint first authors, Jing Yan and Yuan Zhou contributed equally to this work.
Received 2014-3-18; Accepted 2014-3-23; Published 2015-1-5
Citation:
Yan J, Zhou Y, Chen D, Li L, Yang X, You Y, Ling X. Effects of Mitochondrial Translocation of Telomerase on Drug Resistance in Hepatocellular Carcinoma Cells. J Cancer 2015; 6(2):151-159. doi:10.7150/jca.10419. https://www.jcancer.org/v06p0151.htm
Other stylesAbstract
Hepatocellular carcinoma (HCC) cells exhibit multidrug resistance (MDR), but the underlying mechanisms remain unclear. Cancer cells that overexpress telomerase are resistant to chemotherapeutic drugs. This study aimed to determine the effects of mitochondrial translocation of telomerase on MDR in HCC cells. HepG2 cells were transfected with negative plasmid and PTPN11 (Shp-2) short hairpin RNA (ShRNA) plasmid to establish HepG2-negative (HepG2 transfected with negative plasmid) and HepG2-ShShp-2 (HepG2 transfected with Shp-2 ShRNA plasmid) cells. Sensitivity to chemotherapeutic drugs was assessed by Cell Counting Kit-8 (CCK-8) assays. Distribution of human telomerase reverse transcriptase (hTERT) within mitochondria was detected by western blotting and immunofluorescence combined with laser scanning confocal microscopy. Mitochondrial reactive oxygen species (ROS) generation was demonstrated by flow cytometry with the mitochondrial superoxide (Mito-Sox) indicator. The frequency of damaged mitochondrial DNA (mtDNA) was illustrated by quantitative real-time polymerase chain reaction (Q-PCR). Expression of mitochondrial respiratory chain complex subunits ND1 and COXII were also demonstrated by western blotting. Knockdown of Shp-2 in HepG2 cells resulted in upregulation of mitochondrial TERT expression and increased resistance to cisplatin (CDDP) and 5-fluorouracil (5-FU) (resistance indices, 2.094 and 1.863, respectively). In addition, both the mitochondrial ROS and the frequency of mtDNA damage were decreased, and COXII expression was upregulated. Our results suggest that Mitochondrial translocation of hTERT may lead to chemotherapeutic resistance in HCC cells. Mitochondrial hTERT contributes to the drug resistance of tumor cells by reducing ROS production and mtDNA damage, and exerting a protective effect on the mitochondrial respiratory chain.
Keywords: telomerase, mitochondria, multidrug resistance, hepatocellular carcinoma.
Introduction
Telomerase is a reverse transcriptase that consists of an antisense RNA template (TERC) and a telomerase reverse transcriptase (TERT) catalytic subunit. Telomerase is predominantly localized in the nucleus. It employs its own TERC as a template to extend telomeres in cells and delays replicative senescence and cell death. In addition to its telomere-dependent functions, telomerase has telomere-independent functions, such as the promotion of cell growth and proliferation [1, 2], regulation of responses to DNA damage [3, 4], and improvement of resistance to apoptotic cell death [5, 6].
The regulation of telomerase activity occurs at multiple levels, and altering the subcellular distribution of telomerase is one way to regulate its function at the post-transcriptional level. TERT, the active subunit of telomerase, can translocate from the nucleus to the mitochondria under external stress [5-7]. The mitochondrial translocation of TERT is related to its tyrosine phosphorylation status. SRC family kinases, which are tyrosine kinases [8] and the nuclear protein tyrosine phosphatase Shp-2 are involved in the tyrosine phosphorylation of TERT. It has been confirmed that Shp-2 is an important negative regulator of nuclear export of TERT by targeting its tyrosine phosphorylation locus [9].
TERT that is localized in the mitochondria may play different roles to nuclear TERT. Mitochondrial TERT acts as a TERC-independent reverse transcriptase and functions as an RNA-dependent DNA polymerase (RdDP) by using mitochondrial tRNA as a template [10]. Mitochondrial TERT can bind to the RNA component of mitochondrial RNA processing endoribonuclease (RMRP) to form a complex similar to RNA-dependent RNA polymerase (RdRP), which then affects gene silencing at the post-transcriptional level [11,12]. Furthermore, mitochondrial TERT can inhibit reactive oxygen species (ROS) generation, mitochondrial DNA (mtDNA) damage, and stress-induced apoptosis [13-16].
In most tumor cells, TERT is highly expressed to reduce telomere shortening, which is considered to be the basis of the infinite proliferative ability and immortality of cancer cells. Mitochondrial translocation of TERT occurs in tumor cells under stress, and mitochondrial TERT enhances the anti-apoptotic ability of tumor cells [16]. Our previous work demonstrated that human TERT (hTERT) gradually translocates from the nuclei to the mitochondria, and is accompanied with an increase in the resistance index (RI) of drug-resistant HCC cells [17]. In this study, Shp-2 was knocked down by RNA interference (RNAi) in HepG2 cells, resulting in increased mitochondrial translocation of TERT. The effects of the mitochondrial translocation of TERT on the drug resistance of HCC cells and its possible mechanisms were investigated.
Materials and Methods
Materials
The HepG2 cell line was purchased from the Shanghai Institute for Life Sciences. Plasmids expressing Shp-2 short hairpin (shRNA) and empty control vectors were provided by Invitrogen Life Technologies Co. Ltd, USA. The shRNA sequence used for PTPN11 (Shp-2) was 5′-GAAGCACAGUACCGAUUUA-3′, and that for the control vector was 5′-AACUUGAGAAUCGCCUGAA-3′.
Cell culture and transfection
HepG2 cells were maintained at 37°C (5% CO2) in Dulbecco's modified Eagle's medium (DMEM) with high concentrations of glucose, supplemented with 10% fetal bovine serum (FBS), 100 U/mL penicillin, and 100 U/mL streptomycin (HyClone, GE Healthcare Life Sciences, USA).
Plasmids expressing Shp-2 shRNA and empty vector plasmids were transformed into DH5α cells, and amplified in 4 mL liquid Luria-Bertani medium containing 50 µg/mL spectinomycin (Sigma-Aldrich Co. Ltd, USA) at 37°C for 12 h. Then, the plasmids were isolated using an EndoFree Plasmid Mini Kit II (Omegabio-tek Co. Ltd, USA) according to the manufacturer's instructions, and the DNA concentration was measured with a nucleic acid analyzer (Thermo Electron Corporation, USA).
On the day before transfection, HepG2 cells were seeded in 6-well plates (Corning Incorporated, USA) with 2 mL growth medium without antibiotics. Cells were 60-70% confluent at the time of adherence. Plasmids (2.0 µg) were transfected using Lipofectamine 2000 (Invitrogen) according to the manufacturer's instructions. The cells were incubated at 37°C (5% CO2) for 12 h, and the medium was replaced with growth medium containing FBS. At 48 h after transfection, 5 µg/mL blasticidin (Invitrogen) was added to the medium to select the transfected cells. After the majority of non-transfected cells had been killed, medium containing 2.5 µg/mL blasticidin was used to maintain selective pressure.
Shp-2 shRNA knockdown efficiency and mitochondrial hTERT expression
Total protein extraction
Total protein extracts were prepared from HepG2 cells, HepG2-shShp-2 cells (transfected with Shp-2 shRNA-expressing plasmids), and HepG2-negative cells (transfected with empty vector). After removal of the growth medium, cells were washed three times with phosphate-buffered saline (PBS; Beyotime Institute of Biotechnology, China). Then, 200 µL sodium dodecyl sulfate (SDS) lysis buffer (containing 1 mM phenylmethylsulfonyl fluoride) (Beyotime) was added to every 100 mL of culture medium. Cells were harvested using a cell scraper and incubated on ice for 10-15 min. Then, the cell lysate was transferred to a 1.5-mL Eppendorf tube and centrifuged at 10,000-14,000 ×g for 3-5 min at 4°C. The supernatants were collected for total protein analysis.
Mitochondrial protein extraction
Mitochondrial proteins were extracted with a mitochondrial protein extraction kit (Nanjing KeyGEN Biotech Co. Ltd.) according to the manufacturer's instructions. Protein concentration was measured with the BCA protein assay kit (Beyotime).
Shp-2 knockdown efficiency
Shp-2 knockdown efficiency was analyzed as follows: 80 µg of total protein for each sample was separated using 8% SDS-polyacrylamide gel electrophoresis (PAGE) (Beyotime) and transferred onto a PVDF membrane (Roche Co. Ltd, USA). After blocking with 5% nonfat milk for 1 h at room temperature, the membrane was separately incubated with a rabbit anti-Shp-2 monoclonal antibody (1:200) and an anti-β-actin antibody (1:1000) (Beijing Biosynthesis Biotechnology Co. Ltd.) overnight at 4°C. Then, the membrane was washed and incubated with a secondary antibody (1:2000) (Beyotime) for 1 h at room temperature. The membrane was washed again, and the protein bands were visualized using electrochemiluminescence (ECL) reagents (Shanghai Minipore Industrial Co. Ltd.) in a Bio-Rad gel imaging system. β-Actin was used as an internal control to compare the expression of target proteins. The mean Shp-2 expression level from three independent experiments was noted. The results were visualized by exposing to a gel imager and analyzed for densitometry using ImageJ software.
Analysis of mitochondrial and total hTERT expression by western blotting
We loaded 100 µg of mitochondrial proteins onto 6% SDS-PAGE gels to detect hTERT and onto 10% SDS-PAGE gels to detect rabbit anti-mitochondrial transcription factor A (TFAM) monoclonal antibody (Epitomics, Abcam Co. Ltd, UK). We also loaded 80 µg of total proteins onto 6% SDS-PAGE gels to detect total hTERT and onto 8% SDS-PAGE gels to detect β-actin. After transfer onto membranes and blocking with 5% nonfat milk for 1 h at room temperature, we incubated the membranes with rabbit anti-hTERT monoclonal antibody (Abcam Co. Ltd, UK) (1:1000), anti-β-actin (1:1000), or anti-TFAM (1:1000) overnight at 4°C. Then, the membranes were washed and incubated with a secondary antibody (1:2000) for 1 h at room temperature. The membranes were washed again, and the protein bands were visualized using ECL reagents in a Bio-Rad gel imaging system. TFAM and β-actin were used as internal controls to compare the expression of the target proteins. The mean values of mitochondrial hTERT and total hTERT expression were obtained from three independent experiments. The results were also detected by exposing to a gel imager (Bio-Rad) and analyzed for densitometry using ImageJ software.
Detection of drug resistance
The resistance of HepG2, HepG2-shShp-2, and HepG2-negative cells to the chemotherapeutic drugs cisplatin (CDDP), doxorubicin (DOX), and 5-fluorouracil (5-FU; Sigma-Aldrich Co. Ltd, USA) was detected using Cell Counting Kit-8 (CCK-8; Beyotime). HepG2 cells, HepG2-shShp-2, and HepG2-negative cells were digested, counted, and seeded onto 96-well plates (Corning) at a density of 2 × 10⁴ per well in 200 µL medium at 48 h before the experiment. After a 24-h incubation, the cultured cells were adherent. Different concentrations of CDDP (64, 32, 16, 8, 4, 2, and 1 µg/mL), DOX (2.5, 1.25, 0.625, 0.3125, and 0.15625 µg/mL), and 5-FU (64, 32, 16, 8, 4, 2, and 1 µg/mL) were added to the medium. In the control groups, only medium was added. After incubation at 37°C (5% CO2) for 24 h, 20 µL CCK-8 working solution was added, and the cells were incubated for another 2 h at 37°C (5% CO2). The absorbance at 450 nm was detected with a nucleic acid analyzer (Thermo). The relative inhibition rate = (optical density [OD] of control group - OD of drug group)/OD of control group × 100%. The half maximal inhibitory concentration (IC50) was calculated by regression analysis using SPSS 13.0. Then, resistance indices (RIs) were calculated as follows: RI = IC50 of drug group/IC50 of control group. The average RIs of the cells to various chemotherapeutic drugs after three independent experiments were calculated.
Immunofluorescence analysis of mitochondrial hTERT translocation
HepG2 and HepG2-negative cells were digested, counted, and seeded into coverslips within 12-well plates at 48 h before the analysis. After 48 h of incubation at 37°C (5% CO2), HepG2 and HepG2-negative cells were treated with 10 µg/mL CDDP for 24 h. The control group cells were not treated with CDDP. After three washes with PBS, 50 nM/L mitochondrial probe Mito Tracker-deep Red (Invitrogen) was added, and the cells were incubated for 30 min at 37°C (5% CO2). Next, the cells were fixed with 4% paraformaldehyde for 30 min and permeabilized with 0.3% Triton X-100 (Beyotime) for 20-30 min. After blocking with goat serum (Beyotime) for 30 min, the slides were incubated with anti-hTERT primary antibody (1:50) at 4°C overnight. Then, the slides were washed three times with PBS, and incubated with Alexa Fluor-488 donkey anti-rabbit IgG (Invitrogen) (1:1000) for 1 h at room temperature. Finally, 4'-6-diamidino-2-phenylindole was added, and the slides were incubated for another 10 min then observed using confocal microscopy. The images were analyzed using ImageJ and Photoshop software.
Flow cytometric analysis of mitochondrial ROS
HepG2, HepG2-shShp-2, and HepG2-negative cells were digested, counted, and seeded into 6-well plates at 48 h before flow cytometric analysis. After 48 h of incubation at 37°C (5% CO2), HepG2, HepG2-shShp-2, and HepG2-negative cells were treated with 100 µg/mL CDDP for 2, 4, and 6 h. The control groups were not treated. After three washes with PBS, 5 μM/L mitochondrial superoxide indicator (MitoSOX) was added, and the cells were incubated for 30 min at 37°C (5% CO2). Then, the cells were digested with trypsin, and the MitoSOX level was determined using flow cytometry. The data were analyzed using CellQuest software.
Quantitative real-time polymerase chain reaction (Q-PCR) for mtDNA damage measurement
According to the literature [18], damaged mtDNA but not integrated mtDNA can be unwound by heating at 94°C for 2 min, and can thus be amplified. However, upon heating at 94°C for 6 min, both integrated and damaged mtDNA can be unwound and amplified. Furthermore, the degree of mtDNA damage can be determined by its amplification frequency. HepG2, HepG2-shShp-2, and HepG2-negative cells were digested, counted, and seeded into 6-well plates at 48 h before analysis. After 48 h of incubation at 37°C (5% CO2), HepG2, HepG2-shShp-2, and HepG2-negative cells were treated with 10 µg/mL CDDP for 24 h. The control groups were not treated with CDDP. Genomic DNA from the cells in each group was isolated (Tiangen Biothch Co. Ltd, China), and Q-PCR was performed according to the real-time polymerase chain reaction (RT-PCR) kit (Dalian Takara Biotechnology Inc). The mtDNA D-loop HV1 primer was used to amplify the target region and the sequences of the primers were as follows: forward, 5′-GATTTGGGTACCACCCAAGTATTG-3′ (16042-16064); reverse, 5′-AATATTCATGGTGGCTGGCATGTA-3′ (16125-16102) (Takara). The housekeeping gene ACTB (β-actin) was used as a control, and the sequences of primers for this gene were as follows: forward, 5′-TCCCGGCCCCTAGGGTGTAGA-3′; reverse, 5′-GCCGCACCGGCTCTCCAAAT-3′ (Takara). The following amplification conditions were used for RQ1: 94°C for 2 min, followed by 40 cycles at 94°C for 30 s, 60°C for 45 s, and 72°C for 45 s. For RQ2, the amplification conditions were: 94°C for 6 min, followed by 40 cycles at 94°C for 30 s, 60°C for 45 s, and 72°C for 45 s. The ratio of RQ1 to RQ2 was calculated, and was considered to be the amplification frequency, which could determine the degree of mtDNA damage. The data were collected and analyzed using ABI 7500 software.
Analysis of mitochondrial respiratory chain protein expression by western blotting
ND1 and COXII are important components of the mitochondrial respiratory chain complexes I and IV, respectively. HepG2, HepG2-shShp-2, and HepG2-negative cells were digested, counted, and seeded in 100-mL flasks. After incubation for 48 h at 37°C (5% CO2), the cells were treated with 10 µg/mL CDDP for 24 h. Cells not treated with CDDP were used as controls. The total protein concentration was measured using a BCA protein assay kit. Then, 80 µg of total proteins from each sample was separated by 12% SDS-PAGE and transferred onto a membrane. After blocking with 5% nonfat milk for 1 h at room temperature, the membrane was separately incubated with rabbit anti-COXII antibody monoclonal antibody (Epitomics, Abcam Co. Ltd, UK) (1:2000), goat anti-ND1 monoclonal antibody (Santa Cruz Biotechnology Inc, USA) (1:500), and anti-β-actin antibody (1:1000) overnight at 4°C. Then, the membrane was washed and incubated with secondary antibody (1:2000) for 1 h at room temperature. The membrane was washed again, and protein bands were detected by ECL reagents and visualized using a Bio-Rad gel imaging system. β-Actin was used as an internal control to compare the expression of the target proteins. The mean COXII and ND1 expression levels from three independent experiments were noted. The results were analyzed for densitometry using ImageJ software.
Statistical Analysis
Results are expressed as mean ± standard deviation. SPSS version 13.0 software was used for statistical analysis of data with One-Way analysis of variance (ANOVA). When the variance was not homogeneous, the Kruskal-Wallis test was used to substitute it. P values less than 0.05 were considered statistically significant.
Results
Shp-2 suppression by RNAi increased mitochondrial hTERT translocation
Shp-2 tightly regulates the nuclear export of TERT by targeting its tyrosine phosphorylation locus, which functions as a negative regulator [9]. As shown in Figure 1, the expression of Shp-2 was markedly decreased in HepG2-shShp-2 cells, as compared with its expression in HepG2 and HepG2-negative cells. After CDDP treatment, hTERT (green fluorescence) translocated to the cytoplasm. Compared with the control group cells, HepG2-shShp-2 cells exhibited increased colocalization of the fluorescent signals that indicated hTERT and mitochondria (Figure 2A). The mitochondrial expression of hTERT in HepG2-shShp-2 cells was significantly higher than that in HepG2 and HepG2-negative cells after CDDP treatment. However, the total cellular hTERT levels remained stable in HepG2-shShp-2, HepG2, and HepG2-negative cells (Figure 2B).
Elevated mitochondrial hTERT increased resistance to chemotherapeutic drugs
Our previous study demonstrated that in HCC SK-Hep1 cells, higher expression levels of mitochondrial TERT are associated with increasing drug resistance [17]. In the present study, resistance to CDDP and 5-FU was significantly higher in HepG2-shShp-2 cells than in HepG2 and HepG2-negative cells (P<0.05), but resistance to DOX was similar among all three types of cells (P>0.05) (Table 1).
Increased mitochondrial hTERT translocation reduced mitochondrial ROS generation
Mitochondrial ROS generation is an important indicator of mitochondrial function. It has been reported that mitochondrial hTERT can protect mitochondrial function through decreasing mitochondrial ROS generation [14]. After CDDP treatment, MitoSOX expression increased with time in HepG2 and HepG2-negative cells, indicating increased mitochondrial ROS production. In contrast, MitoSOX changed very little in the HepG2-shShp-2 cells after CDDP treatment (Figure 3), which indicated that the increase in the mitochondrial translocation of hTERT led to a reduction in mitochondrial ROS generation.
Mitochondrial hTERT protected against mtDNA damage
MtDNA is proven to be another important indicator of mitochondrial function. It has been claimed that mitochondrial hTERT can inhibit mtDNA damage under stress [13][15]. As shown in Table 2, there was no significant difference in mtDNA damage between HepG2, HepG2-negative, and HepG2-shShp-2 cells prior to drug treatment. After CDDP treatment, the frequency of mtDNA damage was markedly higher in HepG2 and HepG2-negative cells than in HepG2-shShp-2 cells, suggesting that the mitochondrial translocation of hTERT could reduce the mtDNA damage caused by CDDP.
Table 1
Drug resistance detected by CCK-8 assay.
| Drug | HepG2 (IC50 µg/mL) | HepG2-Negative (IC50 µg/mL) | HepG2-ShShp-2 (IC50 µg/mL) | RI |
|---|---|---|---|---|
| CDDP | 15.90±0.09 | 15.45±0.11 | 33.31±5.88* | 2.094 |
| 5-FU | 14.40±0.92 | 13.98±0.15 | 26.83±3.33* | 1.863 |
| DOX | 0.55±0.07 | 0.48±0.05 | 0.58±0.06 | 1.066 |
* P<0.05 vs HepG2 and HepG2-Negative cells. Data were represented as mean±standard deviation.
Table 2
Amplification frequency of mtDNA measured by Q- PCR.
| Condition | HepG2 | HepG2-Negative | HepG2-ShShp-2 |
|---|---|---|---|
| Normal | 1.00±0.12 | 1.04±0.11 | 0.92±0.24 |
| Drug treatment | 2.06±0.38 | 2.02±0.33 | 0.87±0.32# |
# P<0.05 vs HepG2 and HepG2-Negative cells. Data were represented as mean±standard deviation.
Figure 1
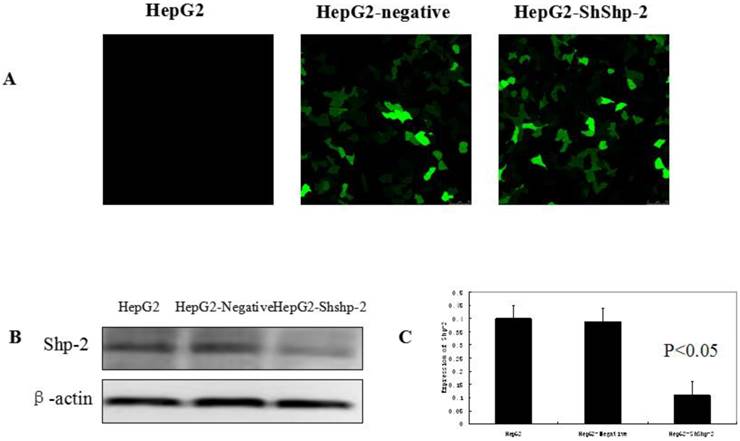
Suppression of Shp-2 by RNAi. (A) HepG2 cells were transfected with Shp-2 shRNA plasmids and control vectors, and then examined using immunofluorescence microscopy. (B) Shp-2 expression was detected by western blot assays. (C) The expression of Shp-2 in HepG2-shShp-2 cells was significantly inhibited compared with that in HepG2 and HepG2-negative cells (P<0.05).
Figure 2
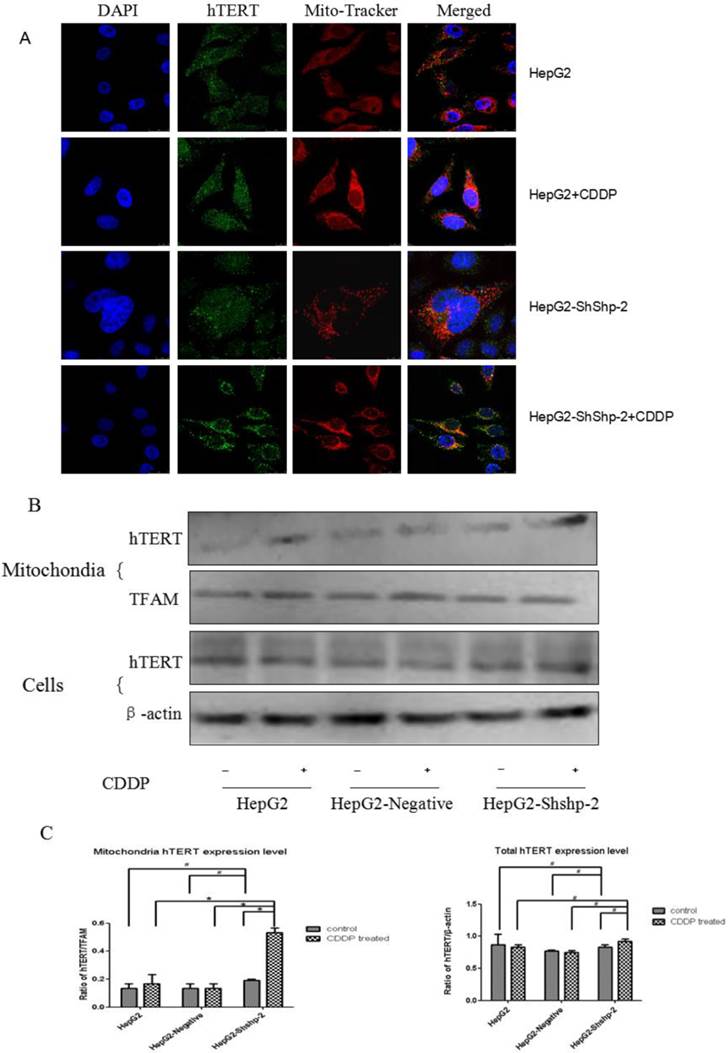
Shp-2 suppression increased mitochondrial translocation of hTERT. (A) Localization of hTERT in the mitochondria was analyzed using immunofluorescence assays. Mitochondria, red fluorescence; hTERT, green fluorescence. (B) Mitochondrial and cell hTERT expression was detected using western blot assays and quantified by densitometry. #P>0.05, HepG2-shShp-2 cells vs. HepG2 and HepG2-negative cells before treatment.*P<0.01, HepG2-shShp-2 vs. HepG2 and HepG2-negative cells after CDDP treatment. Data are presented as mean ± standard deviation.
Figure 3
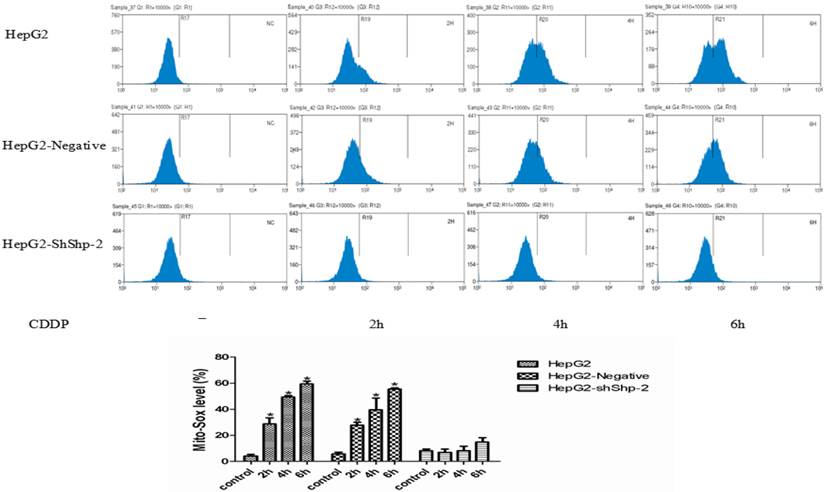
Mitochondrial translocation of hTERT reduced ROS generation. (A) MitoSOX was detected using flow cytometry. (B) MitoSOX detected using flow cytometry was quantified.*P<0.05, HepG2-shShp-2 cells vs. HepG2 and HepG2-negative cells. Data are presented as mean ± standard deviation.
Mitochondrial hTERT translocation increased COX2 expression
ND1 and COXII, which are encoded by mtDNA, are important parts of respiratory chain complexes I and IV. As shown in Figure 4A, CDDP treatment did not significantly alter mitochondrial ND1 expression in HepG2, HepG2-negative, and HepG2-shShp-2 cells. In contrast, mitochondrial COXII expression was significantly decreased in HepG2 and HepG2-negative cells after CDDP treatment. However, there was no obvious change in mitochondrial COXII expression in HepG2-shShp-2 cells after CDDP treatment. These results suggested that hTERT may be involved in the regulation of mitochondrial COXII expression after in vitro CDDP treatment (Figure 4B).
Discussion
The resistance of tumor cells to chemotherapeutic drugs is a major obstacle to clinical chemotherapy. MDR is associated with two types of membrane transport proteins [19]: the ATP-binding cassette transport protein superfamily, which can export chemotherapeutic drugs from the cytosol to the extracellular matrix against the concentration gradient, and the solute carrier superfamily, which can regulate the absorption of chemotherapeutic drugs in tumor cells.
Telomerase is highly expressed in most tumor cells [20,21]. Haendeler et al. [9] showed that tyrosine 707 is a target of the tyrosine phosphatase Shp-2. In our study, when Shp-2 was downregulated in HepG2 cells by RNAi, mitochondrial TERT expression was upregulated, implying that Shp-2 may be a negative regulator of mitochondrial TERT translocation. The tyrosine kinase activity of SRC may be regulated by Shp-2, and they both may be involved in the regulation of the tyrosine phosphorylation of TERT when cells are exposed to stress. Increased tyrosine phosphorylation could enhance the mitochondrial translocation of TERT.
Researchers are increasingly focusing on the effects of telomerase expression on tumor therapy. The expression of hTERT mRNA has been related to the sensitivity of gastric cancer cells to chemotherapeutic drugs [22]. Our previous study demonstrated that in HCC SK-Hep1 cells, higher expression levels of mitochondrial TERT are associated with increasing drug resistance [17]. In the present study, we found that downregulation of Shp-2 expression led to an increase in TERT translocation to the mitochondria. Accordingly, the tumor cells were more resistant to CDDP and 5-FU. Furthermore, we demonstrated that the mitochondrial translocation of TERT in HepG2 cells was increased when the cells were treated with CDDP, indicating that mitochondrial TERT translocation may be involved in the drug resistance of tumor cells.
The mechanism via which mitochondrial TERT enhances the resistance of tumor cells to chemotherapeutic drugs is unclear. Mitochondrial TERT has been demonstrated to decrease mitochondrial ROS generation, and inhibit the mtDNA damage and apoptosis induced by stress [13-16, 23]. Santos et al. [24, 25] showed that inhibition of TERT nuclear export resulted in cells being stressed, blocked the immortalization of cells, and increased the sensitivity of cells to genotoxic stress. Our study showed that downregulation of Shp-2 expression increased the mitochondrial translocation of TERT, and decreased mitochondrial ROS production and the frequency of mtDNA damage.
Figure 4
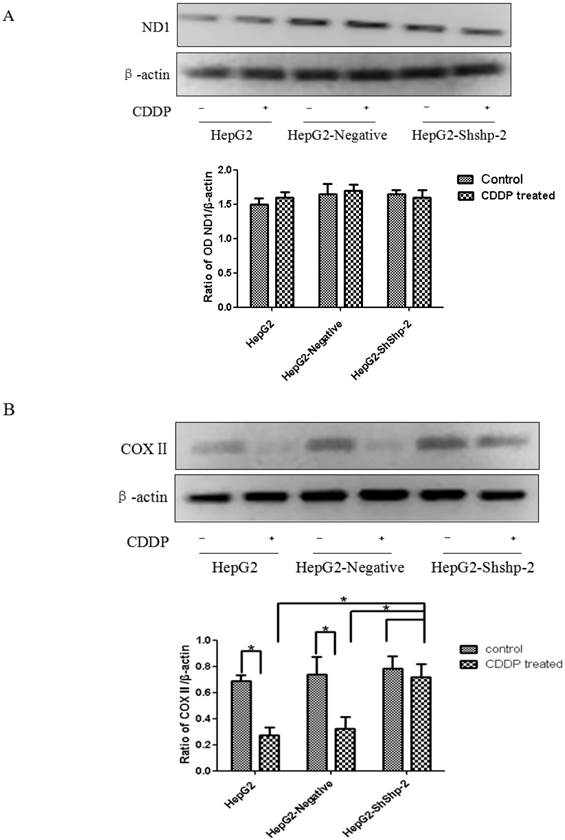
ND1 and COXII expression in HepG2 cells before and after transfection with Shp-2 shRNA plasmids. (A) ND1 expression was detected by western blot assays. No changes in ND1 expression were found in the control or CDDP-treated groups (P>0.05). (B) COXII expression was detected by western blot assays. There was no significant difference in COXII expression between HepG2-shShp-2, HepG2, and HepG2-negative cells before CDDP treatment. However, after CDDP treatment, COX2 expression was significantly higher in HepG2-shShp-2 cells than in HepG2 and HepG2-negative cells. *P<0.05 vs. HepG2 and HepG2-negative cells after CDDP treatment. Data are presented as mean ± standard deviation.
Mitochondria are the major source of ROS, which are mainly produced through the respiratory electron transport chain. Normally, intracellular ROS are dynamically balanced. When cells are exposed to oxidative stress, the endogenous production of ROS exceeds the capacity of the cellular antioxidant defenses, resulting in chemical damage of mtDNA. Mitochondrial DNA contains 37 genes encoding 13 structural proteins that are subunits of various respiratory chain complexes, 22 tRNAs, and two rRNAs. ND1 and COXII, which are encoded by mtDNA, are important components of respiratory chain complexes I and IV. Mitochondrial TERT has been shown to act as a TERC-independent reverse transcriptase and to exhibit RdDP activity by using mitochondrial tRNA as a template [10]. Mitochondrial TERT can bind to the RNA module of RMRP and form a complex similar to RdRP, which then affects gene silencing at the post-transcriptional level [11,12]. Our results suggest that mitochondrial TERT is involved in the regulation of COXII, a subunit of respiratory chain complexes.
Acknowledgements
This work was supported by the National Natural Science Foundation of China (No. 81101892) and the Chongqing Natural Science Foundation (No. 2013C290).
Competing Interests
The authors have declared that no competing interest exists.
References
1. Smith LL, Coller HA, Roberts JM. Telomerase modulates expression of growth-controlling genes and enhances cell proliferation. Nat Cell Biol. 2003;5:474-9
2. Geserick C, Tejera A, Gonzalez-Suarez E. et al. Expression of mTert in primary murine cells links the growth-promoting effects of telomerase to transforming growth factor-beta signaling. Oncogene. 2006;25:4310-9
3. Masutomi K, Possemato R, Wong JMY. et al. The telomerase reverse transcriptase regulates chromatin state and DNA damage responses. P Natl Acad Sci USA. 2005;102:8222-7
4. Gu BW, Bessler M, Mason PJ. A pathogenic dyskerin mutation impairs proliferation and activates a DNA damage response independent of telomere length in mice. P Natl Acad Sci USA. 2008;105:10173-8
5. Mondello C, Bottone MG, Noriki S. et al. Oxidative stress response in telomerase-immortalized fibroblasts from a centenarian. Ann NY Acad Sci. 2006;1091:94-101
6. Lee J, Sung YH, Cheong C. et al. TERT promotes cellular and organismal survival independently of telomerase activity. Oncogene. 2008;27:3754-60
7. Santos JH, Meyer JN, Skorvaga M. et al. Mitochondrial hTERT exacerbates free-radical-mediated mtDNA damage. Aging Cell. 2004;3:399-411
8. Haendeler J, Hoffmann J, Brandes RP. et al. Hydrogen peroxide triggers nuclear export of telomerase reverse transcriptase via Src kinase family-dependent phosphorylation of tyrosine 707. Molecular cellular biology. 2003;23:4598-610
9. Jakob S, Schroeder P, Lukosz M. et al. Nuclear Protein Tyrosine Phosphatase Shp-2 Is One Important Negative Regulator of Nuclear Export of Telomerase Reverse Transcriptase. J Biol Chem. 2008;283:33155-61
10. Sharma NK, Reyes A, Green P. et al. Human telomerase acts as a hTR-independent reverse transcriptase in mitochondria. Nucleic Acids Res. 2012;40:712-25
11. Maida Y, Yasukawa M, Furuuchi M. et al. An RNA-dependent RNA polymerase formed by TERT and the RMRP RNA. Nature. 2009;461:230-U104
12. Maida Y, Masutomi K. RNA-dependent RNA polymerases in RNA silencing. Biol Chem. 2011;392:299-304
13. Santos JH, Meyer JN, Van Houten B. Mitochondrial localization of telomerase as a determinant for hydrogen peroxide-induced mitochondrial DNA damage and apoptosis. Hum Mol Genet. 2006;15:1757-68
14. Indran IR, Hande MP, Pervaiz S. hTERT Overexpression Alleviates Intracelluar ROS Production, Improves Mitochondrial Function, and Inhibits ROS-Mediated Apoptosis in Cancer Cells. Cancer Res. 2011;71:266-76
15. Haendeler J, Drose S, Buchner N. et al. Mitochondrial Telomerase Reverse Transcriptase Binds to and Protects Mitochondrial DNA and Function From Damage. Arterioscl Throm Vas. 2009;29:929-U400
16. Singhapol C, Pal D, Czapiewski R. et al. Mitochondrial Telomerase Protects Cancer Cells from Nuclear DNA Damage and Apoptosis. Plos One. 2013;8:e52989
17. Ling X, Wen L, Zhou Y. Role of mitochondrial translocation of telomerase in hepatocelluar carcinoma cells with mutidrug resistance. Int J Med Sci. 2012;9:545-54
18. Santos JH, Meyer JN, Mandavilli BS. Quantitative PCR-based measurement of nuclear and mitochondrial DNA damage and repair in mammalian cells. Methods Mol Biol. 2006;3:183-99
19. Liu FS. Mechanisms of chemotherapeutic drug resistance in cancer therapy--a quick review. Taiwanese obstetrics & gynecology. 2009;48:239-44
20. Harley CB. Telomerase and cancer therapeutics. Nat Rev Cancer. 2008;8:167-79
21. Ruden M, Puri N. Novel anticancer therapeutics targeting telomerase. Cancer Treat Rev. 2013;39:444-56
22. Wang L, Li PF, Geng M. et al. Correlation between chemosensitivity to anticancer drugs and telomerase reverse transcriptase mRNA expression in gastric cancer. Diagnostic pathology. 2013;8:33-7
23. Ahmed S, Passos JF, Birket MJ. et al. Telomerase does not counteract telomere shortening but protects mitochondrial function under oxidative stress. J Cell Sci. 2008;121:1046-53
24. Kovalenko OA, Kaplunov J, Herbig U. et al. Expression of (NES-)hTERT in Cancer Cells Delays Cell Cycle Progression and Increases Sensitivity to Genotoxic Stress. Plos One. 2010;5(5):e10812
25. Kovalenko OA, Caron MJ, Ulema P. et al. A mutant telomerase defective in nuclear-cytoplasmic shuttling fails to immortalize cells and is associated with mitochondrial dysfunction. Aging Cell. 2010;9:203-19
Author contact
![]() Corresponding author: Xianlong Ling, Department of gastroenterology, Xinqiao Hospital,Third military medical university, Chongqing400037, China. Email: 13228685532cn.
Corresponding author: Xianlong Ling, Department of gastroenterology, Xinqiao Hospital,Third military medical university, Chongqing400037, China. Email: 13228685532cn.
Citation styles
APA
Yan, J., Zhou, Y., Chen, D., Li, L., Yang, X., You, Y., Ling, X. (2015). Effects of Mitochondrial Translocation of Telomerase on Drug Resistance in Hepatocellular Carcinoma Cells. Journal of Cancer, 6(2), 151-159. https://doi.org/10.7150/jca.10419.
ACS
Yan, J.; Zhou, Y.; Chen, D.; Li, L.; Yang, X.; You, Y.; Ling, X. Effects of Mitochondrial Translocation of Telomerase on Drug Resistance in Hepatocellular Carcinoma Cells. J. Cancer 2015, 6 (2), 151-159. DOI: 10.7150/jca.10419.
NLM
Yan J, Zhou Y, Chen D, Li L, Yang X, You Y, Ling X. Effects of Mitochondrial Translocation of Telomerase on Drug Resistance in Hepatocellular Carcinoma Cells. J Cancer 2015; 6(2):151-159. doi:10.7150/jca.10419. https://www.jcancer.org/v06p0151.htm
CSE
Yan J, Zhou Y, Chen D, Li L, Yang X, You Y, Ling X. 2015. Effects of Mitochondrial Translocation of Telomerase on Drug Resistance in Hepatocellular Carcinoma Cells. J Cancer. 6(2):151-159.
This is an open access article distributed under the terms of the Creative Commons Attribution (CC BY-NC) License. See http://ivyspring.com/terms for full terms and conditions.