Journal of Cancer
ISSN: 1837-9664
3.2
Impact Factor
ISSN: 1837-9664

 Global reach, higher impact
J Cancer 2014; 5(8):706-714. doi:10.7150/jca.9787 This issue Cite
Research Paper
Serum Unsaturated Free Fatty Acids: Potential Biomarkers for Early Detection and Disease Progression Monitoring of Non-Small Cell Lung Cancer
Yaping Zhang1, Chengyan He2, Ling Qiu3, Yanmin Wang4, Li Zhang5, Xuzhen Qin3, Yujie Liu1, Dan Zhang1, Zhili Li1 ![]()
1. Department of Biophysics and Structural Biology, Institute of Basic Medical Sciences, Chinese Academy of Medical Sciences & School of Basic Medicine, Peking Union Medical College, Beijing, China;
2. Laboratory Medicine Center, China-Japan Union Hospital of Jilin University, Changchun, China;
3. Department of Clinical Laboratory, Peking Union Medical College Hospital, Chinese Academy of Medical Sciences & Peking Union Medical College, Beijing, China;
4. Department of Clinical Laboratory, Heze Municipal Hospital, Heze, China;
5. Department of Respiratory Medicine, Peking Union Medical College Hospital, Chinese Academy of Medical Sciences & Peking Union Medical College, Beijing, China.
Received 2014-6-2; Accepted 2014-8-13; Published 2014-9-19
Citation:
Zhang Y, He C, Qiu L, Wang Y, Zhang L, Qin X, Liu Y, Zhang D, Li Z. Serum Unsaturated Free Fatty Acids: Potential Biomarkers for Early Detection and Disease Progression Monitoring of Non-Small Cell Lung Cancer. J Cancer 2014; 5(8):706-714. doi:10.7150/jca.9787. https://www.jcancer.org/v05p0706.htm
Other stylesAbstract
Background: Lung cancer (LC) is the deadliest cancer, with earlier stage patients having a better opportunity of long-term survival. The goal of this study is to screen less-invasive and efficient biomarkers for early detection of non-small cell LC (NSCLC).
Material and Methods: We performed the simultaneous quantitative detection of six serum unsaturated free fatty acids (FFAs, C16:1, C18:3, C18:2, C18:1, C20:4, and C22:6) from 317 healthy controls, 78 patients with benign lung diseases (BLD), and 202 patients with NSCLC using chip-based direct-infusion nanoelectrospray ionization-Fourier transform ion cyclotron resonance mass spectrometry (CBDInanoESI-FTICR MS) in the negative ion mode. Multiple point internal standard calibration curves between the concentration ratios of individual fatty acids to internal standards (ISs, C17:1 as IS of C16:1, C18:3, C18:2, and C18:1 and C21:0 as IS of C20:4 and C22:6) and their corresponding intensity ratios were constructed, with correlation coefficient of > 0.99. Mann-Whitney U test was employed to compare the differences in the levels of the FFAs between the patients and healthy controls.
Results: Significantly decreased levels of the FFAs in NSCLC patients were observed compared with healthy controls and BLD patients. Receiver operating characteristic curve analysis indicated that a combination of C16:1, C18:1, C18:3, C18:2, C20:4, and C22:6 could excellently differentiate patients with early-stage NSCLC from healthy controls plus BLD patients, with an AUC value of 0.933, a sensitivity of 84.2%, and a specificity of 89.1%. In addition, a biomarker panel (C16:1 and C18:1) was also confirmed preliminarily to monitor disease progression in NSCLC patients treated with icotinib, with a lead time between 8 and 48 weeks relative to clinical medical imaging.
Conclusion: A combination of C16:1, C18:1, C18:3, C18:2, C20:4, and C22:6 may be a powerful biomarker panel for the early detection of NSCLC and a combination of C16:1 and C18:1for disease progression monitoring of NSCLC.
Keywords: non-small cell lung cancer, biomarker panel, early detection, unsaturated free fatty acids, serum.
Introduction
Lung cancer (LC) is the first leading cause of cancer death and the second most common cancer in USA [1]. In 2012, the incidence and mortality of LC were 53.57 and 45.5 7 per 100,000 people in China, respectively [2]. At present, clinical diagnosis of LC depends mainly on medical imaging, such as chest X-rays and computed tomography, with low sensitivity and specificity not enough to diagnose early stage LC [3, 4]. Low-dose helical computed tomography has reduced the LC death rate up to 20% compared with chest radiography during high-risk population screening [5]. Conventional tumor biomarkers, such as carcino- embryonic antigen and cytokeratin 19 fragments, can provide only low sensitivity (43%-69%) and specificity (68%-89%)[6, 7], which are not suitable for early detection of LC. Except for malignant tumor-associated specific protein biomarkers, tumor-associated autoantibodies, microRNAs, free circulating DNA, and circulating tumor cells have been investigated, and it was found that tumor-associated autoantibodies presented a high specificity, but with low sensitivity[8-10]. Previous case-control studies suggested that a combination of different microRNAs have shown high sensitivities (73%-86%) and specificities (83%-100%) compared with individual microRNAs [11-14]. In addition, elevated levels of circulating plasma DNA in cancer patients were obviously increased compared with healthy controls without being reliable quantitative data [15, 16]. At present, quantitative proteomic approaches have not been used to quantify cancer-related biomarkers [17-19].
Metabolites considered as the endpoint of the omics cascade are associated with progressive disease (PD)[20-22], and changes in the levels of metabolites are also regarded as one of signs of cancer [23]. Free fatty acids (FFAs) are closely associated with metabolic syndrome and insulin resistance, and unsaturated FFAs play a key role in inflammation and cell proliferation and viability, such as arachidonic acid as a precursor for diverse inflammatory molecules [24]. Previous studies have indicated the association of the levels of FFAs with malignancy [25-27]. It is worth noting that fatty-acid oxidation is a predominant pathway for energy generation to meet the energy requirement during cellular proliferation [28]. The roles of dietary fatty acids in the development of human cancer have been investigated extensively, along with some controversial results [29].
In this study, serum unsaturated FFAs from 317 healthy controls, 78 patients with benign lung disease (BLD), and 202 patients with non-small cell LC (NSCLC), along with 8 patients with advanced-stage NSCLC treated with icotinib hydrochloride up to 64-week interval, were detected using chip-based direct-infusion nanoelectrospray ionization-Fourier transform ion cyclotron resonance mass spectrometry (CBDInanoESI-FTICR MS) in the negative ion mode. It was found that a combination of C16:1, C18:3, C18:2, C18:1, C20:4, and C22:6 has an excellent diagnostic ability to differentiate early stage NSCLC patients from healthy controls plus BLD patients, with an AUC of 0.933, a sensitivity of 84.2%, and a specificity of 89.1%.
Materials and Methods
Chemicals and reagents
Palmitoleic acid (C16:1), heptadecenoic acid (C17:1), linolenic acid (C18:3), linoleic acid (C18:2), oleic acid (C18:1), arachidonic acid (C20:4), heneicosanoic acid (C21:0), docosahexaenoic acid (C22:6), and ammonium acetate (all purity > 99% except C22:6 with purity > 98%) were purchased from Sigma-Aldrich Chemicals (St. Louis, MO, USA). HPLC-grade methanol, ethanol and acetonitrile were from Fisher Scientific (Pittsburg, PA, USA). The ultrapure water was purified by a Milli-Q system (Millipore, USA).
Demographic data and study design
All specimens are the remaining sera after clinical laboratory examination. Serum samples of NSCLC patients were from China-Japan Union Hospital (Changchun city, China, n=90) and Peking Union Medical College Hospital (Beijing city, China, n=120). Tumors with the detailed information about cancer staging were further divided into early stage (stage I or II, n = 57) and advanced stage (stage III or IV, n = 87) on the basis of the 7th edition Union for International Cancer Control (UICC) tumor-node metastasis (TNM) classification. 78 patients with BLD were from Peking Union Medical College Hospital. 317 healthy controls were from Heze Municipal Hospital (Shandong Province, China, n=236) and China-Japan Union Hospital (n=81). Detailed characteristics of the above-mentioned participants are listed in Table 1. In addition, we also explored the associations of changes in serum levels of six FFAs in 51 serial serum samples from 8 patients with advanced-stage NSCLC before and during the treatment with icotinib hydrochloride. The clinical characteristic feature and serum sample information are listed in Supplementary Material: Table S1. In this study, all participants have given informed consents, and the study was approved by the Ethics Review Board at the Institute of Basic Medical Sciences, Chinese Academy of Medical Sciences.
Table 1
Characteristics of participants in the training set and the validation set.
| Training Set | Validation Set | ||||||
|---|---|---|---|---|---|---|---|
| Controls (n=162) | NSCLC (n=90) | Controls (n=155) | BLD (n=78) | NSCLC (n=120) | |||
| Age (years) | Male/Female | 95/67 | 57/33 | 80/75 | 40/38 | 79/41 | |
| Mean± SD | 58.6±9.8 | 58.9±10.2 | 58.1±13.2 | 58.0±13.9 | 58.3±11.3 | ||
| Range | 39-77 | 39-73 | 33-82 | 31-82 | 33-79 | ||
| Stage | I & II (Early Stage) | 3/2 | 32/20 | ||||
| III & IV(Advanced Stage) | 24/12 | 31/20 | |||||
| Histology | Adenocarcinoma | 31 | 61 | ||||
| Squamous cell carcinoma | 28 | 42 | |||||
| Small cell carcinoma | 19 | 17 | |||||
SD: standard deviation, NSCLC: non-small cell lung cancer, BLD: benign lung disease.
Standard stock solutions and sample preparations
Standard stock solutions and serum samples were prepared as our own previous study [26]. Briefly, the stock solution of the internal standard (IS) mixture was prepared by dissolving C17:1 and C21:0 at the concentrations of 83.3 µM and 33.3 µM in ethanol, respectively, and further diluted to proper concentrations prior to analysis. For serum sample preparation, 50 µL of serum sample was mixed with 950 µL of methanol/acetonitrile (3/2, v/v) to precipitate serum proteins followed by vortex-mixing for 30 s and stored at -20 °C overnight. After centrifugation at 19000 g for 30 min, an aliquot of 20 µL supernatant was pipetted into a new tube by the addition of 1 µL of the ISs stock solution, 500 µL of hexane, and 500 µL of water followed by vortex-mixing and centrifugation. The upper layer was transferred into a glass vial and air-dried, and then 1 mL of methanol/acetonitrile/5 mM ammonium acetate in water (42/28/30, v/v/v) was added to redissolve sample for mass spectrometric analysis.
Absolute quantification methods
Multiple point internal standard calibration equations were constructed as our own previous study[26]. Briefly, the mixture of C16:1 (342.0 µM), C18:3 (81.7 µM), C18:2 (569.0 µM), C18:1 (836.0 µM), C20:4 (183.0 µM), and C22:6 (56.2 µM) was prepared in ethanol, and further diluted 500-fold by methanol/acetonitrile/5 mM ammonium acetate in water (42/28/30, v/v/v) as STD1 (684.0 nM C16:1, 163.3 nM C18:3, 1137.7 nM C18:2, 1671.7 nM C18:1, 365.7 nM C20:4 and 112.3 nM C22:6). The STD1 was further diluted 2-, 10-, 20-, 50- and 80-fold, termed as STD2(342.0 nM C16:1, 81.7 nM C18:3, 568.8 nM C18:2, 835.8 nM C18:1, 182.8 nM C20:4, and 56.2 nM C22:6), STD3 (68.4 nM C16:1, 16.3 nM C18:3, 113.8 nM C18:2, 167.2 nM C18:1, 36.6 nM C20:4, and 11.2 nM C22:6), STD4 (34.2 nM C16:1, 8.2 nM C18:3, 56.9 nM C18:2, 83.6 nM C18:1, 18.3 nM C20:4, and 5.6 nM C22:6), STD5 (13.7 nM C16:1, 3.3 nM C18:3, 22.8 nM C18:2, 33.4 nM C18:1, 7.3 nM C20:4, and 2.3 nM C22:6), and STD6 (8.6 nM C16:1, 2.0 nM C18:3, 14.2 nM C18:2, 20.9 nM C18:1, 4.6 nM C20:4, and 1.4 nM C22:6), respectively. Then 1 µL of the ISs solution was added into the above six standard mixture solutions with the final concentrations (83.3 nM C17:1 and 33.3 nM C21:0), respectively, to generate the calibration curves. Each was analyzed three times, and the results are expressed as mean ± standard deviation (SD). The calibration curves are constructed between the concentration ratios of fatty acids to ISs (C16:1, C18:3, C18:2, C18:1 to C17:1 and C20:4, C22:6 to C21:0) and their corresponding intensity ratios. STD3 was also used as a quality control (QC) sample to evaluate the experimental stability. The QC sample was analyzed once every 10 test serum samples and finally 66 mass spectra were obtained from the QC sample. The relative SDs of C16:1, C18:3, C18:2, C18:1, C20:4, and C22:6 were computed according to the ratios of their individual intensity to ISs (C17:1 or C21:0), which were used to evaluate the experimental stability and reliability. Simultaneous qualitative and quantitative analysis was performed using a 9.4 T Apex-ultra™ hybrid Qh-FTICR mass spectrometer (Bruker Daltonics, Billerica, MA, USA) equipped with a TriVersa NanoMate system (Advion BioSciences, Ithaca, NY, USA) in the negative ion mode. Identification of serum FFAs was performed based on the observed accurate molecular masses and reliable isotope distributions as described previously [26].
Statistical analysis
Participants with a single serum sample were assigned to the training set and the validation set. The training set included 90 NSCLC patients from China-Japan Union Hospital and 162 age- and sex-matched healthy controls, and the validation set consisted of 120 NSCLC patients from Peking Union Medical College Hospital, 78 BLD patients, and 155 age- and sex-matched healthy controls. In the training set, a comparison of serum FFAs levels between NSCLC patients and healthy controls was performed by Mann-Whitney U test. Receiver operating characteristics (ROC) curve analysis was used to calculate the area under the ROC curve (AUC), cut-off value, sensitivity, and specificity. The prediction model was further confirmed by the validation set at the cut-off value obtained in the training set. For the follow-up test, one-way analysis of variance with the least significant difference test was used to assess the association of the FFAs levels with PD using serial serum samples collected at one time point before treatment and at different time points during the treatment with icotinib hydrochloride. The logarithmic transformation was performed due to non-normal distribution before statistical analysis. All data were analyzed three times, and the data are expressed as mean ± SD. All statistical analyses were performed using SPSS software (version 16.0, Chicago, IL, USA). In all cases, a P value of < 0.05 was considered to be statistically significant.
Results
Simultaneous qualitative and quantitative analysis of serum FFAs
Serum levels of six FFAs in 605 participants with a single time point were simultaneously quantified using CBDInanoESI-FTICR MS in the negative ion mode. It should be noted that the levels of six FFAs in healthy controls from Beijing and Changchun have no statistical significance. Representative negative ion mass spectra of serum FFAs from one healthy control, one patient with BLD, and one NSCLC patient are shown in Supplementary Material: Fig.S1. Multiple point internal standard calibration equations of six FFAs were also constructed (Supplementary Material: Table S2), with excellent correlation coefficient of > 0.99. The data from 66 mass spectra of the QC sample show that the relative SDs of six serum FFAs levels were < 15%, suggesting that the experimental repeatability is acceptable for quantitative analysis of complex biological sample. FFAs detected in this study were identified according to the observed accurate molecular masses with the absolute mass error of ≤ 0.00023 Da and reliable isotope distributions of < 2% between the observed and theoretical values as described previously [26].
Differences in serum levels of six FFAs between healthy controls and LC patients
As shown in Fig. 1, serum levels of six FFAs (C16:1, C18:3, C18:2, C18:1, C20:4, and C22:6) and the level ratio of C18:2 /C18:1 in NSCLC patients were significantly decreased compared with healthy controls in the training set, and similar trends in their levels were also observed in the validation set. In the training set, ROC curve analysis indicated that C18:2, C18:3, monounsaturated fatty acids (MUFAs, C16:1 and C18:1), polyunsaturated fatty acids (PUFAs, C18:3, C18:2, C20:4, and C22:6), and panel a consisting of C16:1, C18:3, C18:2, C18:1, C20:4, and C22:6 have a good diagnostic ability to differentiate patients with NSCLC from healthy controls, with the AUC values of > 0.8 (Table 2). It is worth noting that panel a has the highest diagnostic ability, and its ROC curve is shown in Fig. 2a. Its diagnostic ability was further confirmed based on the independent validation set, with an AUC of 0.909, a sensitivity of 85.0%, and a specificity of 75.7%. The ROC curve is shown in Fig. 2b.
Table 2
The AUC values, cut-off values, sensitivity, and specificity of FFAs and their combinations between controls and patients.
| FFAs | Training set | cut- off | Validation set | ||||||||||||||
|---|---|---|---|---|---|---|---|---|---|---|---|---|---|---|---|---|---|
| Controls vs. NSCLC | Controls vs. NSCLC | Controls vs. BLD | BLD vs. NSCLC | ||||||||||||||
| AUC (95% CI) | Sens (%) | Spec (%) | AUC (95% CI) | Sens (%) | Spec (%) | AUC (95% CI) | Sens (%) | Spec (%) | cut- off | AUC (95% CI) | Sens (%) | Spec (%) | cut- off | ||||
| C16:1 | 0.717(.653-.781) | 52.5 | 75.6 | 44.6 | 0.644(.576-.711) | 53.5 | 63.8 | 0.618(.537-.699) | 52.6 | 74.2 | 60.1 | 0.719(.646-.792) | 66.7 | 65.8 | 44.6 | ||
| C18:3 | 0.846(.790-.902) | 84.6 | 68.9 | 14.6 | 0.831(.781-.880) | 92.3 | 54.2 | 0.818(.758-.877) | 89.7 | 54.2 | 14.6 | ||||||
| C18:2 | 0.818(.762-.875) | 93.2 | 52.5 | 179.0 | 0.886(.842-.930) | 92.3 | 72.5 | 0.813(.751-.875) | 76.9 | 72.5 | 179.0 | ||||||
| C18:1 | 0.792(.732-.853) | 79.0 | 63.3 | 255.0 | 0.739(.679-.800) | 66.5 | 65.0 | 0.604(.522-.687) | 88.4 | 34.6 | 212.6 | 0.611(.529-.694) | 50.0 | 65.0 | 255.0 | ||
| C20:4 | 0.779(.719-.839) | 63.0 | 78.9 | 114.6 | 0.759(.703-.816) | 59.4 | 79.2 | 0.752(.685-.819) | 57.7 | 72.9 | 114.6 | ||||||
| C22:6 | 0.713(.649-.778) | 66.7 | 71.7 | 20.5 | 0.778(.721-.836) | 79.4 | 67.2 | 0.773(.707-.838) | 83.3 | 67.5 | 20.5 | ||||||
| C18:2/C18:1 | 0.608(.531-.686) | 84.0 | 35.6 | 0.7 | 0.752(.693-.811) | 83.2 | 55.8 | 0.679(.603-.755) | 48.7 | 81.9 | 1.0 | 0.843(.786-.899) | 91.0 | 55.8 | 0.7 | ||
| C18:3/C18:1 | 0.511(.425-.597) | 34.6 | 80.0 | 0.1 | 0.673(.596-.749) | 87.2 | 40.0 | 0.06 | |||||||||
| MUFAs | 0.822(.765-.878) | 80.0 | 67.3 | 0.3 | 0.742(.681-.802) | 83.3 | 40.0 | 0.757(.692-.822) | 80.8 | 60.6 | 0.3 | 0.689(.611-.766) | 97.5 | 12.8 | 0.3 | ||
| PUFAs | 0.875(.829-.921) | 85.6 | 64.8 | 0.2 | 0.896(.855-.936) | 83.3 | 70.3 | 0.843(.787-.900) | 97.5 | 37.2 | 0.2 | ||||||
| Panel a | 0.887(.842-.931) | 83.3 | 76.5 | 0.3 | 0.909(.871-.947) | 85.0 | 75.7 | 0.920(.881-.958) | 90.8 | 73.1 | 0.3 | ||||||
| Panel b | 0.655(.572-.739) | 51.3 | 80.0 | 0.4 | 0.869(.818-.920) | 85.8 | 73.1 | 0.5 | |||||||||
NSCLC: non-small cell lung cancer; BLD: benign lung diseases; Sens: sensitivity; Spec: specificity; MUFAs: C16:1 and C18:1; PUFAs: C18:3, C18:2, C20:4, and C22:6; panel a: C16:1, C18:3, C18:2, C18:1, C20:4, and C22:6; panel b: C18:2/C18:1 and C18:3/C18:1.
Differences in serum levels of six FFAs between healthy controls and BLD patients
A comparison of healthy controls and patients with BLD was also performed to assess the correlation of serum levels of FFAs with BLD. As shown in Fig. 1, serum levels of C16:1 or C18:1 in BLD patients were significantly increased or decreased compared to healthy controls (P < 0.01), whereas the levels of PUFAs were not associated with BLD. ROC curve analysis demonstrated that MUFAs could generate a relatively high AUC value of 0.757, with a sensitivity of 80.8% and a specificity of 60.6% to differentiate BLD patients from healthy controls. The ROC curve for MUFAs is shown in Fig. 2c.
Figure 1
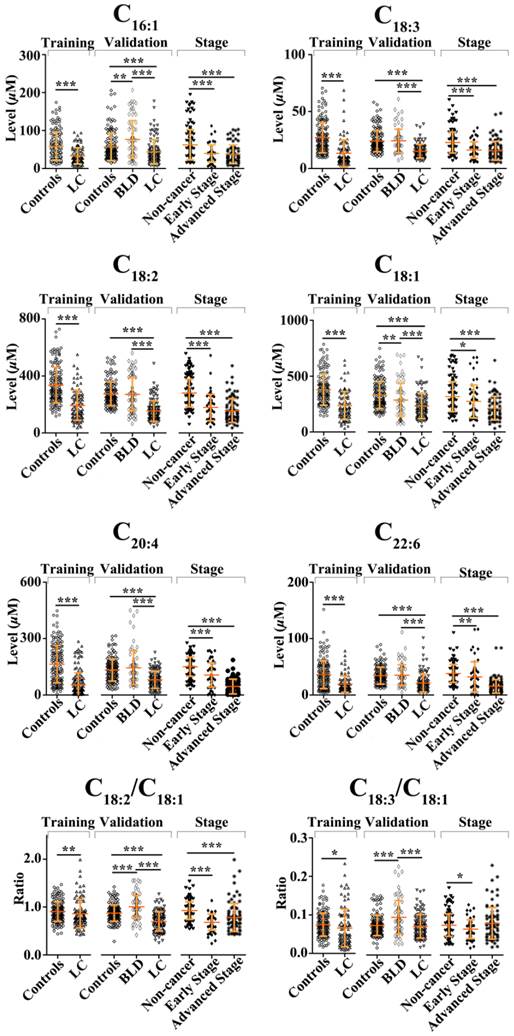
Scatter plots of serum levels of FFAs in the training set (healthy controls vs. NSCLC patients), the validation set (healthy controls vs. NSCLC patients, healthy controls vs. BLD patients, and BLD patients vs. NSCLC patients), and staging (non-cancer participants vs. early-stage or advanced-stage patients). *, P < 0.05; **, P< 0.01; and ***, P< 0.001.
Differences in serum levels of six FFAs between BLD and NSCLC patients Serum levels of C16:1, C18:3, C18:2, C18:1, C20:4, and C22:6, and the level ratios of C18:2/C18:1 and C18:3/C18:1 in NSCLC patients were significantly decreased compared with BLD patients (P < 0.001, Fig. 1). ROC curve analysis between BLD and NSCLC patients was performed based on the above-mentioned variables and their combinations. As shown in Table 2, panels a and b, along with C18:2/C18:1 and C18:3/C18:1, exhibit an excellent diagnostic accuracy to differentiate NSCLC patients from BLD patients, with the AUC values of > 0.86, the sensitivities of > 85.8%, and the specificities of > 73%. Representative ROC curve for panel a is shown in Fig. 2d.
Differences in serum levels of six FFAs between non-cancer participants and patients with different stage NSCLC
As shown in Fig. 1, significant changes in serum levels of six FFAs were observed between non-cancer participants (healthy controls plus BLD patients) and patients with early-stage or advanced-stage NSCLC. The levels of C16:1, C18:3, C18:2, C18:1, C20:4, and C22:6 and the level ratio of C18:2/C18:1 in patients with early-stage or advanced-stage NSCLC were significantly decreased compared with non-cancer participants (P < 0.05, Fig. 1). ROC curve analysis revealed that panel a has an excellent diagnostic ability to differentiate patients with early-stage or advanced-stage NSCLC from non-cancer participants, with the AUC values of > 0.933, the sensitivities of > 84.2%, and the specificities of > 89.1% (Table 3). These ROC curves for panel a are shown in Figs 2e and 2f. It should be noted that C20:4, C22:6, and PUFAs also have an excellent diagnostic ability to discriminate patients with advanced-stage NSCLC from non-cancer participants, with the AUC values of > 0.92, the sensitivities of > 81%, and the specificities of > 80% (Table 3).
Association of PD with changes in serum levels of FFAs in NSCLC patients treated with icotinib hydrochloride
To investigate the association of PD with changes in serum FFAs levels in 8 cases of NSCLC patients treated with icotinib hydrochloride, 51 serial serum samples from 8 NSCLC patients were also analyzed using CBDInanoESI-FTICR MS in the negative ion mode. The smooth lines above the histogram were plotted to describe change trends in serum FFAs levels during the treatment. As shown in Fig. 3, serum levels of MUFAs (C16:1 and C18:1) at certain point was statistically significantly increased or decreased during the treatment compared with their respective baselines (0 week before the treatment) (P < 0.05). More importantly, changes in serum levels of MUFAs were statistically significantly associated with PD detected by medical imaging. It is also found that serum levels of PUFAs consisting of C18:3, C18:2, C20:4, and C22:6, were also correlated slightly with PD. Based on the resulting data in Fig. 3, one-way analysis of variance with the least significant difference test indicated that time intervals between time points of statistically significant changes in serum levels of MUFAs and PD are from 8 to 48 weeks for 8 patients treated with icotinib hydrochloride.
Figure 2
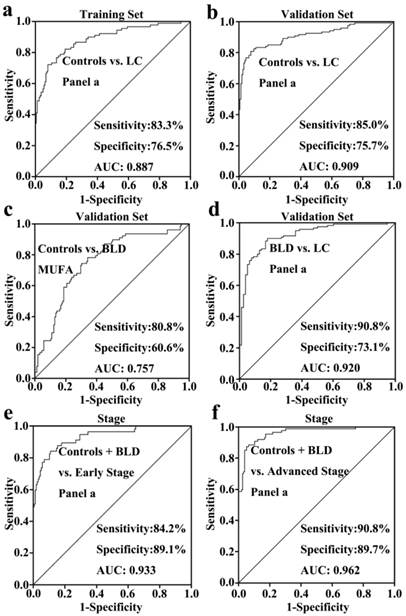
ROC curve analysis of different biomarker panels of six FFAs. (a) panel a (including C16:1, C18:3, C18:2, C18:1, C20:4, and C22:6) for differentiating NSCLC patients from healthy controls in the training set. (b) panel a for differentiating NSCLC patients from healthy controls in the validation set. (c) MUFAs ( including C16:1 and C18:1) for differentiating BLD patients from healthy controls. (d) panel a for differentiating NSCLC patients from BLD patients. (e) panel a for differentiating patients with early-stage NSCLC from non-cancer participants (healthy controls plus BLD patients). (f) panel a for differentiating patients with advanced-stage NSCLC from non-cancer subjects.
Table 3
The AUC values, cut-off value, sensitivity, and specificity of FFAs and their combinations between patients with different stage NSCLC and controls plus patients with BLD.
| FFAs | Controls plus BLD vs. Early stage NSCLC | Controls plus BLD vs. Advanced stage NSCLC | |||||
|---|---|---|---|---|---|---|---|
| AUC (95% CI) | Sens (%) | Spec (%) | Cut off | AUC (95% CI) | Sens (%) | Spec (%) | |
| C16:1 | 0.679(.599-.760) | 59.6 | 68.4 | 44.6 | 0.706(.636-.776) | 57.1 | 69.0 |
| C18:3 | 0.725(.642-.808) | 89.1 | 49.1 | 14.6 | 0.769(.702-.837) | 89.1 | 57.5 |
| C18:2 | 0.790(.713-.867) | 91.0 | 59.6 | 179.0 | 0.853(.797-.909) | 90.4 | 70.1 |
| C18:1 | 0.621(.530-713) | 71.2 | 57.9 | 255.0 | 0.737(.669-.804) | 73.7 | 64.4 |
| C20:4 | 0.712(.627-.798) | 77.6 | 64.9 | 114.6 | 0.942(.913-.970) | 81.4 | 94.3 |
| C22:6 | 0.650(.552-.747) | 89.1 | 45.6 | 20.5 | 0.925(.890-.960) | 89.1 | 80.5 |
| C18:2/C18:1 | 0.841(.782-.901) | 92.3 | 61.4 | 0.7 | 0.732(.660-.805) | 75.6 | 65.5 |
| C18:3/C18:1 | 0.598(.512-.684) | 71.8 | 43.9 | 0.06 | |||
| MUFAs | 0.679(.599-.760) | 68.4 | 59.6 | 0.3 | 0.739(.671-.806) | 64.4 | 71.8 |
| PUFAs | 0.829(.764-.894) | 80.7 | 69.2 | 0.2 | 0.957(.931-.983) | 94.3 | 83.3 |
| Panel a | 0.933(.894-.972) | 84.2 | 89.1 | 0.3 | 0.962(.939-.986) | 90.8 | 89.7 |
| Panel b | 0.871(.810-.932) | 66.7 | 96.8 | 0.5 | |||
NSCLC: non-small cell lung cancer; BLD: benign lung diseases; MUFAs: C16:1 and C18:1; PUFAs: C18:3, C18:2, C20:4, and C22:6; panel a: C16:1, C18:3, C18:2, C18:1, C20:4, and C22:6; panel b: C18:2/C18:1 and C18:3/C18:1.
Figure 3
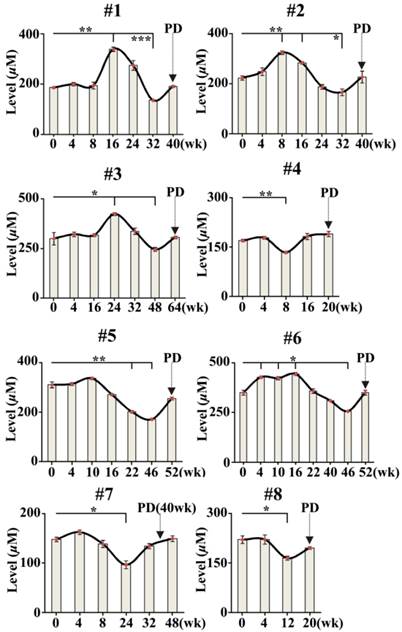
Time-dependent changes in sum levels of MUFAs (C16:1 and C18:1) in NSCLC patients treated with icotinib. Statistical significances in serum levels of MUFAs for each patient were analyzed by analysis of variance with the least significant difference test. p value of less than 0.05 was considered to be statistically significant. PD represents progressive disease detected by medical imaging. *, P< 0.05 and **, P< 0.01.
Discussion
In this study, we employed CBDInanoESI-FTICR MS platform to rapidly perform simultaneous absolute quantification of six serum FFAs in 605 serum samples from 317 healthy controls, 78 patients with BLD, and 210 NSCLC patients, with a single time point, and in 51 serial serum samples from 8 cases of NSCLC patients treated with icotinib hydrochloride. It should be pointed out that it took less than 30s to analyze one sample based on this technique platform, with relative SD of < 15%, suggesting that this platform is a powerful tool to rapidly detect serum levels of FFAs.
As shown in Fig. 1, serum levels of C16:1 and C18:1 in patients with BLD are significantly increased and decreased compared with healthy controls, respectively (P < 0.01), whereas both significantly increased compared with patients with NSCLC (P < 0.001). In addition, no differences in the levels of PUFAs (C18:2, C18:3, C20:4, and C22:6) between healthy controls and patients with BLD were observed, whereas significant differences in their levels were detected between patients with BLD and patients with NSCLC (P < 0.001). Our data suggest that the different mechanisms of serum FFA synthesis may be involved in among healthy controls, BLD patients, and NSCLC patients, especially for BLD and NSCLC. Increased C16:1 levels and decreased C18:1 levels in BLD patients compared with healthy controls in this study are in contrast to previous study, which revealed an obvious increase in the levels of C18:1 in phosphatidylcholine of idiopathic pulmonary fibrosis patients [30].
Previous studies have demonstrated that changes in erythrocyte and platelet fatty acid composition were closely associated with the advanced NSCLC [31-33]. A significant increase of body weight in LC patients who took n-3 PUFAs was observed compared with the controls who took placebo, suggesting that n-3 PUFAs may play a role in anti-inflammatory action [34]. A case-control study revealed that dietary intake of meet including n-6 PUFAs was likely to reduce the risk of LC, whereas consumption of fish increased the risk of LC [35]. Emerging data for human studies indicate that the roles of dietary fat intake in the cancer risk are controversial. To our knowledge, there are few studies concerning the link between changes in serum FFAs levels and risk of lung diseases based on the absolute quantitative data of serum FFAs. In our study, we have found and validated that serum levels of FFAs as novel type of biomarkers are significantly correlated with higher risk of NSCLC, which is consistent with previous study [36]. Decreased levels of unsaturated FFAs in NSCLC patients may relate to the energy demands in response to tumor cell proliferation, which may be closely associated with their roles in lipidperoxidation as well as modulation of lipid metabolism [37].
Previous study also indicated that carcino embryonie antigen and cytokeratin 19 fragments, as well as their combination might be helpful in distinguishing LC from BLD with high specificities (95% - 98%), but with lower sensitivities of (11% - 41%) [7]. Our data indicate that panel a consisting of C16:1, C18:3, C18:2, C18:1, C20:4, and C22:6 has an excellent diagnostic power to differentiate patients with early-stage or advanced-stage NSCLC from healthy controls plus patients with BLD, with the AUC value of > 0.93, the sensitivities of > 84%, and the specificities of > 89%. Our previous study has indicated that a combination of the level ratios of C18:2/C18:1and C18:3/C18:1 provides an excellent diagnostic accuracy to differentiate early-stage pancreatic cancer from the patients with pancreatitis plus normal controls, with the AUC of 0.912, the sensitivity of 86.7%, and the specificity of 88.6%[26]. Total FFAs are able to discriminate healthy controls from patients with breast cancer, with an AUC of 0.731, a sensitivity of 75.9%, and a specificity of 67.6% [27].
Tumor biomarkers may also play an important role in developing more powerful therapeutic strategies. In general, medical imaging is carried out to monitor PD and to evaluate therapeutic efficiency once every 2 months during cancer treatment. In the present study, we also employed CBDInanoESI-FTICR MS platform to detect changes in serum FFAs levels in 8 patients with advanced-stage NSCLC during the treatment with icotinib hydrochloride. As shown in Fig. 3, significant fluctuations in sum level of serum C16:1 and C18:1 are associated with PD. Changes in the levels of serum FFAs might contribute to energy homeostasis to meet the requirement of PD. Serum fatty acids are from dietary intake or de novo fatty-acid biosynthesis, and they are the key substrates for biological membrane synthesis, membrane saturation, and cholesterol lipid hormones, especially for cancer cell growth and proliferation. In addition, decreased serum levels of FFAs are an important cause of insulin resistance, which can contribute to cancer development [38]. It should be noted that serum levels of MUFAs (C16:1 and C18:1) in NSCLC patients treated with icotinib failed to reach those in healthy controls and BLD patients (458.0 ± 108.8 µM and 442.7 ± 103.9 µM, respectively, Figs 1 and 3) during the cancer treatment. Our findings indicate that changes in the levels of FFAs could predict the PD in advance or make a time point for drug resistance. This intriguing observation requires further investigation based on a large sample size. In addition, our data may suggest that targeting fatty acids metabolism may also offer novel therapeutic strategies for cancer treatment and PD monitoring.
Supplementary Material
Fig.S1, Table S1 and S2
Acknowledgements
This study was funded by the grant (No. 91029701) from the National Natural Science Foundation of China (to Z. Li).
Conflict of Interest
All authors disclose any affiliations that are consideration to be relevant and important with any organization that to our knowledge has any direct interest in the subject matter discussed.
References
1. Siegel R, Ma J, Zou Z, Jemal A. Cancer statistics, 2014. CA Cancer J Clin. 2014;64:9-29
2. National Cancer Center. Disease Prevention and Control Bureau, Ministry of Health. Chinese cancer registry annual report. Beijing: Military Medical Sciences Press. 2012
3. Fujikawa A, Takiguchi Y, Mizuno S, Uruma T, Suzuki K, Nagao K, Niijima M, Edo H, Hino M, Kuriyama T. Lung cancer screening--comparison of computed tomography and X-ray. Lung Cancer. 2008;61:195-201
4. Van't Westeinde SC, van Klaveren RJ. Screening and early detection of lung cancer. Cancer J. 2011;17:3-10
5. Aberle DR, Berg CD, Black WC, Church TR, Fagerstrom RM, Galen B, Gareen IF, Gatsonis C, Goldin J, Gohagan JK. et al. The National Lung Screening Trial: overview and study design. Radiology. 2011;258:243-253
6. Zhang D, Ren WH, Gao Y, Wang NY, Wu WJ. Clinical significance and prognostic value of pentraxin-3 as serologic biomarker for lung cancer. Asian Pac J Cancer Prev. 2013;14:4215-4221
7. Okamura K, Takayama K, Izumi M, Harada T, Furuyama K, Nakanishi Y. Diagnostic value of CEA and CYFRA 21-1 tumor markers in primary lung cancer. Lung Cancer. 2013;80:45-49
8. Wu L, Chang W, Zhao J, Yu Y, Tan X, Su T, Zhao L, Huang S, Liu S, Cao G. Development of autoantibody signatures as novel diagnostic biomarkers of non-small cell lung cancer. Clinical Cancer Research. 2010;16:3760-3768
9. Boyle P, Chapman CJ, Holdenrieder S, Murray A, Robertson C, Wood WC, Maddison P, Healey G, Fairley GH, Barnes AC. et al. Clinical validation of an autoantibody test for lung cancer. Ann Oncol. 2011;22:383-389
10. Khattar NH, Coe-Atkinson SP, Stromberg AJ, Jett JR, Hirschowitz EA. Lung cancer-associated auto-antibodies measured using seven amino acid peptides in a diagnostic blood test for lung cancer. Cancer Biol Ther. 2010;10:267-272
11. Hennessey PT, Sanford T, Choudhary A, Mydlarz WW, Brown D, Adai AT, Ochs MF, Ahrendt SA, Mambo E, Califano JA. Serum microRNA biomarkers for detection of non-small cell lung cancer. PLoS One. 2012;7:e32307
12. Zheng D, Haddadin S, Wang Y, Gu LQ, Perry MC, Freter CE, Wang MX. Plasma microRNAs as novel biomarkers for early detection of lung cancer. Int J Clin Exp Pathol. 2011;4:575-586
13. Shen J, Todd NW, Zhang H, Yu L, Lingxiao X, Mei Y, Guarnera M, Liao J, Chou A, Lu CL. et al. Plasma microRNAs as potential biomarkers for non-small-cell lung cancer. Lab Invest. 2011;91:579-587
14. Leidinger P, Keller A, Borries A, Huwer H, Rohling M, Huebers J, Lenhof HP, Meese E. Specific peripheral miRNA profiles for distinguishing lung cancer from COPD. Lung Cancer. 2011;74:41-47
15. Kumar S, Guleria R, Singh V, Bharti AC, Mohan A, Das BC. Efficacy of circulating plasma DNA as a diagnostic tool for advanced non-small cell lung cancer and its predictive utility for survival and response to chemotherapy. Lung Cancer. 2010;70:211-217
16. Paci M, Maramotti S, Bellesia E, Formisano D, Albertazzi L, Ricchetti T, Ferrari G, Annessi V, Lasagni D, Carbonelli C. et al. Circulating plasma DNA as diagnostic biomarker in non-small cell lung cancer. Lung Cancer. 2009;64:92-97
17. Yang J, Song YC, Song TS, Hu XY, Guo YM, Li ZF, Dang CX, Huang C. Identification of novel low molecular weight serum peptidome biomarkers for non-small cell lung cancer (NSCLC). J Clin Lab Anal. 2012;26:148-154
18. Ostroff RM, Bigbee WL, Franklin W, Gold L, Mehan M, Miller YE, Pass HI, Rom WN, Siegfried JM, Stewart A. et al. Unlocking biomarker discovery: large scale application of aptamer proteomic technology for early detection of lung cancer. PLoS One. 2010;5:e15003
19. Patz EF Jr, Campa MJ, Gottlin EB, Kusmartseva I, Guan XR, Herndon JE 2nd. Panel of serum biomarkers for the diagnosis of lung cancer. J Clin Oncol. 2007;25:5578-5583
20. Nolen BM, Langmead CJ, Choi S, Lomakin A, Marrangoni A, Bigbee WL, Weissfeld JL, Wilson DO, Dacic S, Siegfried JM. et al. Serum biomarker profiles as diagnostic tools in lung cancer. Cancer Biomark. 2011;10:3-12
21. Hori S, Nishiumi S, Kobayashi K, Shinohara M, Hatakeyama Y, Kotani Y, Hatano N, Maniwa Y, Nishio W, Bamba T. et al. A metabolomic approach to lung cancer. Lung Cancer. 2011;74:284-292
22. Guo Y, Wang X, Qiu L, Qin X, Liu H, Wang Y, Li F, Chen G, Song G, Guo S. et al. Probing gender-specific lipid metabolites and diagnostic biomarkers for lung cancer using Fourier transform ion cyclotron resonance mass spectrometry. Clin Chim Acta. 2012;414:135-141
23. Hanahan D, Weinberg RA. Hallmarks of cancer: the next generation. Cell. 2011;144:646-674
24. Calder PC. Polyunsaturated fatty acids and inflammatory processes: New twists in an old tale. Biochimie. 2009;91:791-795
25. Huang Q, Tan Y, Yin P, Ye G, Gao P, Lu X, Wang H, Xu G. Metabolic characterization of hepatocellular carcinoma using nontargeted tissue metabolomics. Cancer Res. 2013;73:4992-5002
26. Zhang Y, Qiu L, Wang Y, Qin X, Li Z. High-throughput and high-sensitivity quantitative analysis of serum unsaturated fatty acids by chip-based nanoelectrospray ionization-Fourier transform ion cyclotron resonance mass spectrometry: early stage diagnostic biomarkers of pancreatic cancer. Analyst. 2014;139:1697-1706
27. Lv W, Yang T. Identification of possible biomarkers for breast cancer from free fatty acid profiles determined by GC-MS and multivariate statistical analysis. Clin Biochem. 2012;45:127-133
28. Liu Y. Fatty acid oxidation is a dominant bioenergetic pathway in prostate cancer. Prostate Cancer Prostatic Dis. 2006;9:230-234
29. Serini S, Piccioni E, Merendino N, Calviello G. Dietary polyunsaturated fatty acids as inducers of apoptosis: implications for cancer. Apoptosis. 2009;14:135-152
30. Schmidt R, Meier U, Markart P, Grimminger F, Velcovsky HG, Morr H, Seeger W, Gunther A. Altered fatty acid composition of lung surfactant phospholipids in interstitial lung disease. Am J Physiol Lung Cell Mol Physiol. 2002;283:L1079-1085
31. de Castro J, Hernandez-Hernandez A, Rodriguez MC, Llanillo M, Sanchez-Yague J. Comparison of changes in erythrocyte and platelet fatty acid composition and protein oxidation in advanced non-small cell lung cancer. Cancer Invest. 2006;24:339-345
32. de Castro J, Rodriguez MC, Martinez-Zorzano VS, Hernandez-Hernandez A, Llanillo M, Sanchez-Yague J. Erythrocyte and platelet phospholipid fatty acids as markers of advanced non-small cell lung cancer: comparison with serum levels of sialic acid, TPS and Cyfra 21-1. Cancer Invest. 2008;26:407-418
33. de Castro J RM, Martínez-Zorzano VS, Llanillo M, Sánchez-Yagüe J. Platelet linoleic acid is a potential biomarker of advanced non-small cell lung cancer. Experimental and molecular pathology. 2009;87:226-233
34. Finocchiaro C, Segre O, Fadda M, Monge T, Scigliano M, Schena M, Tinivella M, Tiozzo E, Catalano MG, Pugliese M. et al. Effect of n-3 fatty acids on patients with advanced lung cancer: a double-blind, placebo-controlled study. Br J Nutr. 2012;108:327-333
35. Dosil-Diaz O, Ruano-Ravina A, Gestal-Otero JJ, Barros-Dios JM. Meat and fish consumption and risk of lung cancer: A case-control study in Galicia, Spain. Cancer Lett. 2007;252:115-122
36. Murphy RA, Bureyko TF, Mourtzakis M, Chu QS, Clandinin MT, Reiman T, Mazurak VC. Aberrations in plasma phospholipid fatty acids in lung cancer patients. Lipids. 2012;47:363-369
37. Gregor JI, Heukamp I, Kilian M, Kiewert C, Schimke I, Kristiansen G, Walz MK, Jacobi CA, Wenger FA. Does enteral nutrition of dietary polyunsaturated fatty acids promote oxidative stress and tumour growth in ductal pancreatic cancer? Experimental trial in Syrian Hamster. Prostaglandins Leukot Essent Fatty Acids. 2006;74:67-74
38. Santos CR, Schulze A. Lipid metabolism in cancer. FEBS J. 2012;279:2610-2623
Author contact
![]() Corresponding author: Zhili Li, Department of Biophysics and Structural Biology, Institute of Basic Medical Sciences, Chinese Academy of Medical Sciences & School of Basic Medicine, Peking Union Medical College, 5 Dongdan San Tiao, Beijing 100005, China. Tel/Fax: +86-10-69156479; E-mail: lizhilipumc.edu.cn.
Corresponding author: Zhili Li, Department of Biophysics and Structural Biology, Institute of Basic Medical Sciences, Chinese Academy of Medical Sciences & School of Basic Medicine, Peking Union Medical College, 5 Dongdan San Tiao, Beijing 100005, China. Tel/Fax: +86-10-69156479; E-mail: lizhilipumc.edu.cn.
Citation styles
APA
Zhang, Y., He, C., Qiu, L., Wang, Y., Zhang, L., Qin, X., Liu, Y., Zhang, D., Li, Z. (2014). Serum Unsaturated Free Fatty Acids: Potential Biomarkers for Early Detection and Disease Progression Monitoring of Non-Small Cell Lung Cancer. Journal of Cancer, 5(8), 706-714. https://doi.org/10.7150/jca.9787.
ACS
Zhang, Y.; He, C.; Qiu, L.; Wang, Y.; Zhang, L.; Qin, X.; Liu, Y.; Zhang, D.; Li, Z. Serum Unsaturated Free Fatty Acids: Potential Biomarkers for Early Detection and Disease Progression Monitoring of Non-Small Cell Lung Cancer. J. Cancer 2014, 5 (8), 706-714. DOI: 10.7150/jca.9787.
NLM
Zhang Y, He C, Qiu L, Wang Y, Zhang L, Qin X, Liu Y, Zhang D, Li Z. Serum Unsaturated Free Fatty Acids: Potential Biomarkers for Early Detection and Disease Progression Monitoring of Non-Small Cell Lung Cancer. J Cancer 2014; 5(8):706-714. doi:10.7150/jca.9787. https://www.jcancer.org/v05p0706.htm
CSE
Zhang Y, He C, Qiu L, Wang Y, Zhang L, Qin X, Liu Y, Zhang D, Li Z. 2014. Serum Unsaturated Free Fatty Acids: Potential Biomarkers for Early Detection and Disease Progression Monitoring of Non-Small Cell Lung Cancer. J Cancer. 5(8):706-714.
This is an open access article distributed under the terms of the Creative Commons Attribution (CC BY-NC) License. See http://ivyspring.com/terms for full terms and conditions.