Impact Factor ISSN: 1837-9664

 Global reach, higher impact
J Cancer 2014; 5(6):406-416. doi:10.7150/jca.7680 This issue Cite
Research Paper
Predictive Simulation Approach for Designing Cancer Therapeutic Regimens with Novel Biological Mechanisms
Nicole A. Doudican1 ![]() , Amitabha Mazumder2, Shweta Kapoor3, Zeba Sultana3, Ansu Kumar3, Anay Talawdekar3, Kabya Basu3, Ashish Agrawal3, Aditi Aggarwal3, Krithika Shetty3, Neeraj K Singh3, Chandan Kumar3, Anuj Tyagi3, Neeraj Kumar Singh3, Janitha C Darlybai3, Taher Abbasi4, Shireen Vali3,4
, Amitabha Mazumder2, Shweta Kapoor3, Zeba Sultana3, Ansu Kumar3, Anay Talawdekar3, Kabya Basu3, Ashish Agrawal3, Aditi Aggarwal3, Krithika Shetty3, Neeraj K Singh3, Chandan Kumar3, Anuj Tyagi3, Neeraj Kumar Singh3, Janitha C Darlybai3, Taher Abbasi4, Shireen Vali3,4
1. The Ronald O. Perelman Department of Dermatology, New York University School of Medicine, New York, New York, USA;
2. New York University Cancer Institute, New York, New York, USA;
3. Cellworks Research India Limited - R&D Center, Bangalore, India;
4. Cellworks Group Inc., San Jose, CA, USA.
Received 2013-9-16; Accepted 2014-2-1; Published 2014-4-25
Abstract
Introduction Ursolic acid (UA) is a pentacyclic triterpene acid present in many plants, including apples, basil, cranberries, and rosemary. UA suppresses proliferation and induces apoptosis in a variety of tumor cells via inhibition of nuclear factor kappa-light-chain-enhancer of activated B cells (NFκB). Given that single agent therapy is a major clinical obstacle to overcome in the treatment of cancer, we sought to enhance the anti-cancer efficacy of UA through rational design of combinatorial therapeutic regimens that target multiple signaling pathways critical to carcinogenesis.
Methodology Using a predictive simulation-based approach that models cancer disease physiology by integrating signaling and metabolic networks, we tested the effect of UA alone and in combination with 100 other agents across cell lines from colorectal cancer, non-small cell lung cancer and multiple myeloma. Our predictive results were validated in vitro using standard molecular assays. The MTT assay and flow cytometry were used to assess cellular proliferation. Western blotting was used to monitor the combinatorial effects on apoptotic and cellular signaling pathways. Synergy was analyzed using isobologram plots.
Results We predictively identified c-Jun N-terminal kinase (JNK) as a pathway that may synergistically inhibit cancer growth when targeted in combination with NFκB. UA in combination with the pan-JNK inhibitor SP600125 showed maximal reduction in viability across a panel of cancer cell lines, thereby corroborating our predictive simulation assays. In HCT116 colon carcinoma cells, the combination caused a 52% reduction in viability compared with 18% and 27% for UA and SP600125 alone, respectively. In addition, isobologram plot analysis reveals synergy with lowered doses of the drugs in combination. The combination synergistically inhibited proliferation and induced apoptosis as evidenced by an increase in the percentage sub-G1 phase cells and cleavage of caspase 3 and poly ADP ribose polymerase (PARP). Combination treatment resulted in a significant reduction in the expression of cyclin D1 and c-Myc as compared with single agent treatment.
Conclusions Our findings underscore the importance of targeting NFκB and JNK signaling in combination in cancer cells. These results also highlight and validate the use of predictive simulation technology to design therapeutics for targeting novel biological mechanisms using existing or novel chemistry.
Keywords: ursolic acid, c-Jun N-terminal kinase, NFκB, computer modeling, carcinogenesis
Introduction
Cancer, a manifestation of uncontrolled cell growth in the body, arises due to accumulation of genetic aberrations that are either acquired or inborn. Cancer's unregulated cell growth is the result of various combinations of mutations, each with a unique effect on cellular function via modulation of the proteome, kinome and metabolome. Given the complex etiology of cancer and the robust nature of tumor cells, the achievement of significant therapeutic efficacy through the use of a single agent has been met with limited success. The initial clinical responses of targeted inhibition of key driver pathways typically succumb to the development of resistance. Hence, in the backdrop of constantly evolving tumor cell network dynamics that harness parallel and redundant pathways to promote survival, the need to rationally design combinatorial therapeutics is critical. Therefore, we sought to identify novel combinations of molecularly targeted agents from across indications that synergize to improve therapeutic options for cancer patients.
We have previously demonstrated the anti-tumor effects of ursolic acid (UA) in androgen-dependent as well as androgen-independent prostate cancer cell lines and xenografts [1]. UA (3β-hydroxy-urs-12-en-28-oic-acid) is a pentacyclic triterpenoid that belongs to the cyclosqualenenoid family [2]. UA is a major component of certain traditional medicinal plants and possesses a wide range of biological effects, such as anti-inflammatory, antioxidative, and cytotoxic activities [1, 3]. We have previously characterized the primary mechanism of action of UA as an inhibitor of nuclear factor kappa-light-chain-enhancer of activated B cells (NFκB). In addition, UA has been reported to suppress proliferation, induce apoptosis, and inhibit tumor promotion, metastasis, and angiogenesis across a wide panel of tumor cells [4-8].
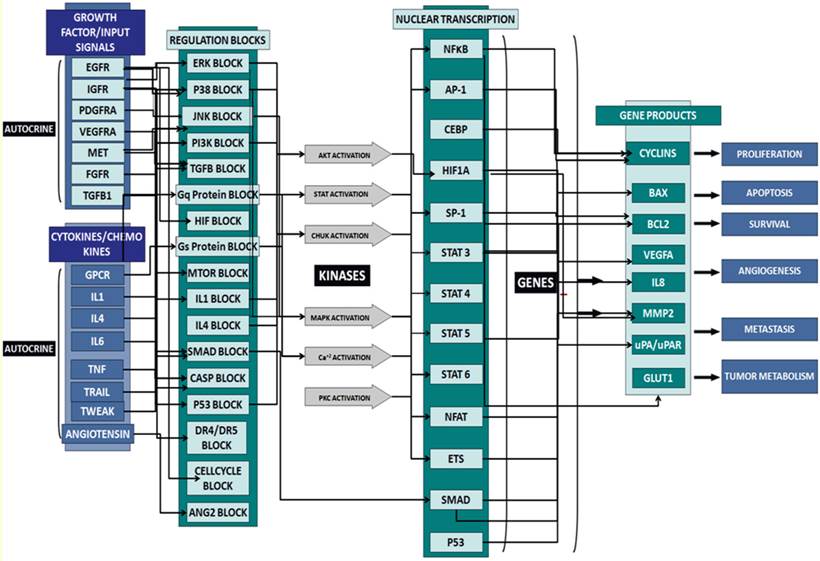
In this study, we used predictive simulation modeling of cancer physiology to design and shortlist agents that further enhance the therapeutic efficacy of UA. Cancer physiology simulation technology (Cellworks Group, San Jose, CA, USA) can be used to conduct high-throughput studies to assess complex biological mechanisms resulting from drug treatment. Specifically, it predicts mechanisms targeted by combinations of drugs that synergistically interact to reduce viability, proliferation and other biologically relevant endpoints. The predictive simulation technology comprehensively incorporates integrated networks of signaling and metabolic pathways that underlie all cancerous phenotypes. A high-level schematic of the network circuitry of various key signaling pathways, message transduction cascades and transcription factor-mediated regulation of gene expression incorporated into the simulation platform is shown in Figure 1. This predictive approach was used to test a library of molecularly targeted drugs in combination with UA in a panel of cancer cell lines. The drugs were combined at different dose ratios via simulation-based studies, resulting in the analysis of a large number of functional phenotypes, including proliferation, viability, angiogenesis, and biomarker expression. Based on this high throughput analysis, we shortlisted a therapeutic biological mechanism based on the combination of UA with the pan-JNK inhibitor SP600125 that was predicted to display synergistic efficacy on cancer phenotypes at reduced drug doses. The novel combination was experimentally validated in corresponding cancer cell lines at the phenotype and biomarker levels. Our design objective was synergistic efficacy, and our experimental results prospectively confirmed the predictions.
Schematic of the network circuitry of the Cellworks Tumor Cell Platform that provides a high-level view of the cross-talk among the growth factor receptor pathways and major signaling cascades in tumor cells. Both autocrine and paracrine signaling within the tumor cell are represented. Growth factor receptors, such as epidermal growth factor receptor (EGFR), insulin-growth factor receptor (IGFR), and hepatocyte growth factor (HGF), activate signaling cascades, resulting in the activation of key kinases, such as Akt, IKKa, and MAPKs. Activated cellular kinases converge to activate various transcription factors, such as NFkB, ETS1, and STATs. As a consequence of these events, downstream genes, including BCL2, cyclins, and MMPs, are activated. These genes are associated with cancer-specific phenotypes including proliferation, apoptosis, angiogenesis, and metastasis. The cross-talk represented in our control tumor cell platform is customized to different tumor profiles by over-laying the corresponding gene mutations.
Materials and methods
Cancer Simulation Model
The predictive computational studies of the drugs were performed using the functional cancer physiology-aligned simulation model of epithelial and plasma cells by Cellworks Group, Inc. The epithelial and plasma cell models are comprised of different networks with differential gene expression and microenvironments. The epithelial cell model is primarily driven by growth factors, whereas the plasma cell model is governed by cytokine and chemokine signals. These kinetically driven simulation models are a comprehensive representation of signaling and metabolic pathways, integrating cancer phenotypes, such as proliferation, apoptosis, viability, angiogenesis, tumor metabolism and metastasis. The simulation allows for “what-if” studies and functional screening of drugs with complete transparency of the underlying pathway networks at the bio-marker level. This technique has been extensively validated through prospective and retrospective studies showing positive correlation between predictive readouts and wet-lab assays [9-16].
The simulation model has been developed through a bottom-up approach by manual inference of bio-chemical signaling networks from research and aggregation using mathematical representation. The manual inference and representation of functional relationships enables the handling of contradictory datasets and connectivity across research studies. The simulation model is constantly enhanced, and the current version represents over 6000 proteins with crosstalk interactions. The model provides comprehensive coverage of the kinome, transcriptome, proteome and, to a lesser extent, the metabolome. Selected examples of pathways represented in the model include: EGFR, PDGFRA, FGFR, c-MET, VEGFR, IGF-1R, mTOR, p53, HIF, apoptosis, cell-cycle, DNA damage repair, ER-stress, autophagy, ubiquitin proteasome machinery, cytokine pathways, lipid mediators, and tumor metabolism. Time-dependent changes in the fluxes of the constituent pathway have been modeled utilizing a modified ordinary differential equation (ODE) and mass action kinetics. Table 1 lists the bio-markers associated with the definition of different cancer phenotypes.
Bio-markers associated with the definition of the different cancer phenotypes.
| INDEX NAME | INDEX MARKERS |
|---|---|
| Proliferation Index | CDK4-CCND1, CDK2-CCNA, CDK2-CCNE, CDC2-CCNB1 |
| Viability Index | Survival Markers/Apoptosis Markers |
| Apoptosis | BAX, CASP3, CASP8, NOXA and BIM |
| Survival | AKT, BCL2, MCL1, BIRC5, BIRC2 and XIAP |
Simulation Protocol
The cancer simulation model is initialized to a normal physiological control state wherein all biological species attain steady state. This non-transformed cell is triggered to represent corresponding cell lines by overlaying the cell's mutation profile on the network by introducing mutations or other genetic and epigenetic changes that modulate the functional levels of genes and proteins. Finally, the drugs are added individually and in combination by introducing the primary biological mechanisms. The study is simulated, and endpoint markers and phenotypes are assayed. The simulation concentration 'C' for each drug is the IC30 value with respect to viability as assessed in simulated dose response studies.
Creation of Cell Line Models
To create a simulation model equivalent for each cell line, mutational information is derived from resources, such as Sanger, Cancer Cell line Encyclopedia (CCLE) and other literature, and functionally introduced. The simulation cell line models are validated by a set of experimental studies to confirm accuracy. The mutational profiles of the cell lines used in this study are outlined in Table 2.
Genotypic characteristics of cell lines modeled in this study. Genes listed under the heading of genotype have been previously reported to be mutated in the indicated cell line. Del = deletion.
| Cell line | Tissue Type | Definition |
|---|---|---|
| HCT116 | Colorectal | KRAS,PIK3CA,P53-WT,CDKN2A,CTNNB1,PTGS2-Del,BCL2,LPA1,DP1-Del |
| HT29 | Colorectal | BRAF,PIK3CA,CDKN2A,APC,SMAD4,P53-Mut,PTGS2,IGFBP3 |
| H292 | Lung | CDKN2A,PTEN,P53-WT,PTGS2 |
| H1155 | Lung | KRAS,PTEN,P53-Mut,P73-Del,RB1-Del,CTNBB1-Del,CDKNIA,CDKN1B,PTGS2-Del,APC,CDH1,IL6-Del,CEBPA-Del,RASSF1-Del |
| H1437 | Lung | P53-Mut, CDKNA, APC, TIMP3, CDH1, MEK, PTGS2-Del |
| MDAMB231 | Breast | KRAS,BRAF,CDKN2A,CDKN2B,P53-Mut,ITGA5/B1,ITGA3,ITGB3,ITGA2,ITGA6,ANXA2,SOCS1,CDH1,ANXA1-Del,RASSF1-Del |
| OPM2 | Multiple myeloma | KRAS,P53-Mut,PTEN,SOCS3,SOCS1,BCL2,CDH1,cMYC,CDKN2A,FGFR3,MALT1,RASSF1,RARB,CDKN2C,WHSC1 |
| IM9 | Multiple myeloma | NRAS,CDKN2A,CDKN1C,NR3C1-Del,SOD2-Del |
Simulation of Drug Effect
The drug is introduced in the simulation model after deriving the mechanism of action (MOA) based on published research and validation of the MOA across retrospective studies. The directly inhibited/activated primary target (as well as secondary and tertiary targets in some cases) of the compound reported in the literature is modulated with experimentally determined kinetic constants. In this study, UA is represented as an NFκB inhibitor [1, 17-18]. The drug concentration is explicitly assumed to be post absorption, distribution, metabolism and excretion (AMDE).
Over 100 targeted drug agents were screened in combination with UA at various doses using the aforementioned simulation platform in over 2000 pair-wise studies. The starting concentrations of all drugs tested in this study were chosen based on IC50 values for viability assessed via simulation studies. The drugs were combined at concentrations corresponding to each drug's IC20 and IC30 viability value. The combined effect was assayed via predictive simulation on an extensive panel of biomarkers of proliferation and apoptosis, including cyclinD1, c-MYC, BAX and caspase 3 (CASP3). Novel biological mechanisms were identified and shortlisted based on a reduction of proliferation and viability endpoints by at least 30% and synergistic impact. The bio-markers assayed for various biological endpoints are listed in Table 1.
Fibroblast Simulation Model
The combination was tested for possible toxicities using human fibroblast cell computational simulation technology. This simulation model represents important signaling pathways in fibroblasts comprised of growth factors including EGF, PDGFA/B, FGF1/2, c-MET, CTGF, and IGF-1; cytokine pathways including IL1A/B, IL4, IL6, IL10, IL15, IL17, IL18, TNFA, IFNA/B/Y, CD40, and TGFB; GPCR signaling such as PGE2, PGI2, EDN1/2/3, S1P, elastin fragments/tropoelastin, and LPA; and cholesterol biosynthesis and oxidative stress pathways. Similar to the cancer simulation model, the fibroblast model also incorporates time-dependent fluxes and stimuli, which utilizes modified ordinary differential equations and mass action kinetics. This study was performed on non-triggered, control fibroblast cells.
Reagents
UA, SP600125, MTT, Tris, glycine, NaCl, SDS, BSA, β-actin antibodies were purchased from Sigma-Aldrich (St. Louis, MO, USA). Dulbecco's Modified Eagle Medium (DMEM) media, fetal bovine serum (FBS), 0.4% trypan blue vital stain, and antibiotic-antimycotic mixture were obtained from Invitrogen (Carlsbad, CA, USA). Antibodies against procaspase-3, cyclin D1, and c-MYC as well as goat anti-rabbit-horse radish peroxidase (HRP) conjugate and goat anti-mouse HRP secondary antibodies were obtained from Santa Cruz Biotechnology (Santa Cruz, CA, USA).
Cell Lines
The human colorectal cancer cell line HCT116 and murine embryonic fibroblast (MEF) cell lines were kindly provided by Prof. Bharat B Aggarwal from MD Anderson Cancer Center. OPM2 and BJ fibroblasts were obtained from the American Type Culture Collection (ATCC, Manassas, VA, USA). All cell lines were cultured in Dulbecco's Modified Eagle Medium (DMEM) containing 1 X antibiotic-antimycotic solution with 10% FBS.
Cell Proliferation Assays
The anti-proliferative effect of the tested compounds was determined using the MTT dye uptake method as described previously [19]. Briefly, 5x10³ HCT116 cells/ml were incubated in triplicate in a 96-well plate in the presence or absence of indicated concentrations of compounds in a final volume of 0.2 ml at 37 °C for indicated periods of time. Thereafter, 20 μl MTT solution (5 mg/ml in PBS) was added to each well. After incubation at 37 °C for 2 hours, 0.1 ml lysis buffer (20% SDS, 50% dimethylformamide) was added. Lysates were incubated at 37 °C for 1 hour, and then the optical density (OD) at 570 nm was measured using a Tecan plate reader (Mannedorf, Switzerland).
For OPM2 studies, 5,000 cells per well were plated in 96-well culture plates. After overnight incubation, the cells were treated with indicated concentrations of SP and UA alone or in combination. Following a 48 hour incubation period, cellular proliferation was assessed using a tetrazolium dye reduction assay (CellTiter 96 Aqueous Non-Radioactive Cell Proliferation Assay; Promega, Madison, WI, USA) according to the manufacturer's instructions. Absorbance was recorded on a microplate reader at 495 nm. Cellular proliferation was expressed as a percentage of vehicle-treated cells, which was defined as 100% viable.
Western Blotting
For the detection of various proteins, treated cells were lysed in lysis buffer (20 mM Tris, pH 7.4; 250 mM NaCl; 2 mM EDTA, pH 8.0; 0.1% TritonX-100; 0.01 mg/ml aprotinin; 0.005 mg/ml leupeptin; 0.4 mM PMSF; 4 mM NaVO4). Lysates were centrifuged at 14,000 rpm for 10 min to remove insoluble material and resolved on a 7.5% SDS gel. After electrophoresis, the proteins were electrotransferred to a nitrocellulose membrane, blocked with 5% non-fat milk, and probed with anti-c-Myc, cyclinD1, c-Jun, phospho-c-Jun (Ser73) and procaspase 3 antibodies (1:1000 dilution; Cell Signaling Technology, Danvers, MA, USA) overnight at 4°C. An anti-β-actin antibody (Sigma, St. Louis, MO, USA) was used as a loading control. The blot was washed, exposed to HRP-conjugated secondary antibodies (Cell Signaling Technology, Danvers, MA, USA) for 1 hour, and examined by chemiluminescence (ECL; GE Healthcare, Little Chalfont, Buckinghamshire, UK).
Flow Cytometric Analysis
To determine the effects of UA and SP on cell cycle distribution, cells were exposed to indicated concentrations of UA and SP alone or in combination for 48 hours. Thereafter, cells were washed, fixed with 70% ethanol, and incubated in 0.1% RNase A in PBS for 30 min at 37 °C. Cells were then washed, resuspended, and stained with 25 μg/ml propidium iodide (PI) in PBS for 30 min at room temperature. Cell cycle distribution was analyzed with a CyAn ADP flow cytometer (DakoCytomation; Dako, Glostrup Denmark).
Results
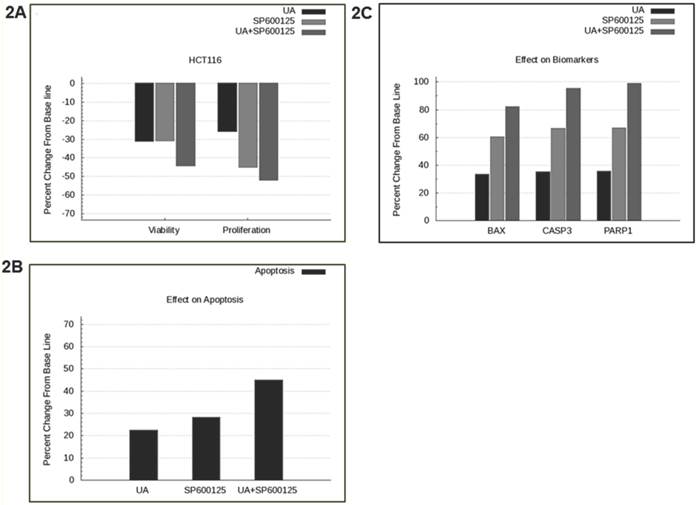
SP600125 is predicted to enhance the anti-cancer activity of UA across a panel of cell lines. Previously, UA was shown to inhibit NFκB and possess anti-angiogenic and pro-apoptotic activities in prostate cancer cells [1]. In this study, we tested the effect of UA alone and in combination with over 100 other drugs using a predictive simulation approach with cell lines from colorectal cancer, non-small cell lung cancer and multiple myeloma. We analyzed the mechanistic effects of the drug combination compared with individual drugs on viability and proliferation phenotypes. Therapeutic combination of UA and SP600125 was shortlisted because it was predicted to demonstrate maximal inhibition on these endpoints at the lowest concentrations across a panel of cancer cell lines (Additional File 1: Supplementary Figure 1). The shortlisted therapeutic program was tested in the colorectal cancer cell line HCT116, which harbors KRAS and PI3KCA mutations. The UA and SP600125 combination was predicted to demonstrate enhanced efficacy on the key tumor endpoints of viability and proliferation in HCT116 cells (Figure 2A). Simulation results from the HCT116 baseline profile also demonstrated an enhanced apoptotic induction with UA and SP600125 in combination as compared with either agent alone (Figure 2B). The increased apoptotic effect is evidenced by increased predictive expression of apoptotic biomarkers, such as BAX dimers, cleaved PARP1 and cleaved CASP3 (Figure 2C).
Predictive simulation results of UA and SP600125 in HCT116 colorectal cancer cells. Predictively derived IC30 concentrations both individually and in combination were used to assess the effects on (A) proliferation and viability phenotypes, (B) apoptosis phenotype, and (C) apoptotic biomarkers including BAX, Cleaved CASP3 and Cleaved PARP1. The phenotype indexes for proliferation, viability and apoptosis are functions of biomarkers listed in Table 1. The proliferation phenotype index is a function of key cell-cycle checkpoint complexes. The apoptotic phenotype index includes pro-apoptotic biomarkers, and viability is a ratio of the survival index (function of pro-survival and anti-apoptotic markers) and apoptotic index.
Prospective validation of the predictive combination in HCT116 cells. The predicted therapeutic efficacy of the UA and SP600125 combination was validated in vitro in HCT116 cells through assessment of proliferation and viability. We tested UA at doses ranging from 1 to 10 μM in combination with SP600125 concentrations ranging from 1 to 30 μM (Additional File 1: Supplementary Figure 2). The combination of 7.5 μM UA with 10 μM SP600125 showed maximal reduction in viability as assessed by the MTT assay, thereby corroborating the predictive simulation assays (Figure 3A, B). The combination reduced viability by 52% compared with 18% for 7.5 μM UA alone and 27% for 10 μM SP600125 alone (Figure 3B). Consistent with the simulated predictions, the combination synergistically enhanced apoptosis as evidenced by the increased percentage sub-G1 phase cells upon treatment with 7.5 μM UA and 10 μM SP600125 (Figure 3C). As shown by flow cytometry, the percentage of cells in the sub-G1 phase of the cell cycle was 15.9% for UA alone, 14.6% for SP alone and 36.8% for combination treatment (Figure 3C). An increased percentage of sub-G1 cells indicates an increase in the number of apoptotic cells as predicted for this combination therapy (Figures 2B and 3C) [20].
Experimental correlation of the predictive simulation based results in HCT116 colorectal cancer cells. A.) Predictive simulation results that show an enhanced reduction of viability index with the combination of UA and SP600125 over the individual drugs in HCT116. B.) Experimental results where HCT116 cells were treated with 7.5 uM UA and 10 uM SP600125, either alone or in combination, for 48 hours. Viability was assayed by MTT assay. Cell viability was reduced by 18% with UA alone, 27% SP600125 alone and 52% with combination treatment. Bars represent the mean of 3 independent experiments. Error bars indicate the standard error of the mean (SEM). C.) Effect of the UA-SP600125 combination on the cell cycle in HCT116 cells. Cells were treated with 7.5 uM UA and 10 uM SP600125, alone and in combination, for 48 hours then assessed by flow cytometry following staining with propidium iodide. The percentage of cells in the Sub-G1 phase is indicated. The figure displays a representative image of 3 independent experiments. D.) Predictive results of the effect of 7.5 uM UA and 10 uM SP600125, alone and in combination, on biomarkers of proliferation and apoptosis. E.) The effect of 7.5 uM UA and 10 uM SP600125, alone and in combination, on biomarkers of proliferation and apoptosis as seen in Western blot. The following biomarkers were assessed: cyclin D1, c-MYC and CASP3. Figure 3E is a representative image of 3 independent experiments.
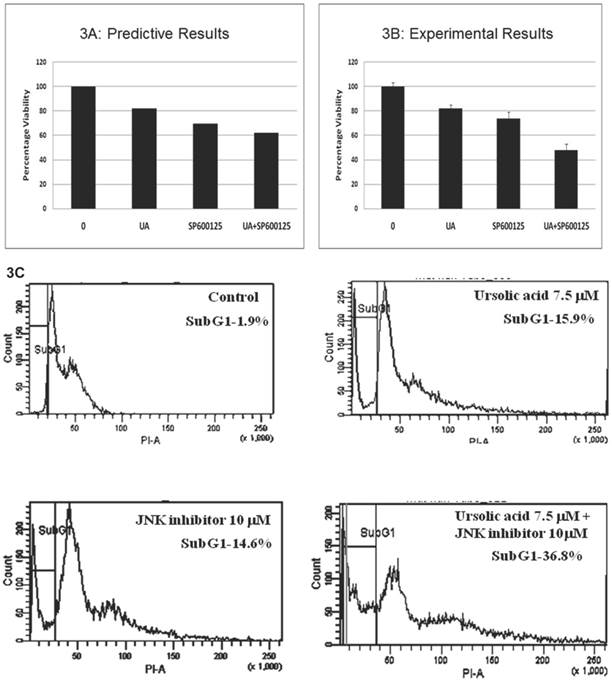
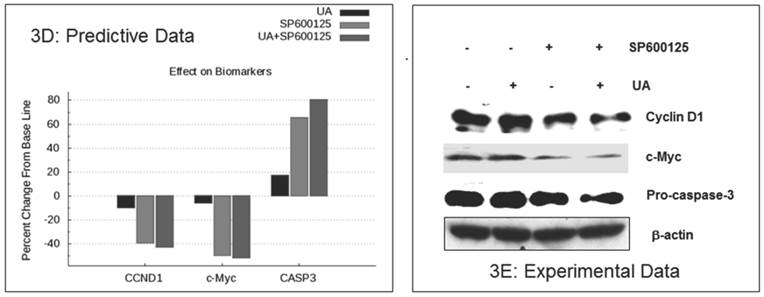
The enhanced inhibition of cellular proliferation was predicted to occur via reduced expression of the proliferation biomarkers c-MYC and cyclin D1by combination treatment as compared with individual drugs (Figure 3D). These biomarkers were assayed in HCT116 cells by Western blot. As shown in Figure 3E, combination treatment resulted in a significant reduction in cyclin D1 and c-MYC expression as compared with single agent treatment. The in vitro experimental data also showed a reduction of pro-caspase 3, which indicates an increase in CASP3 cleavage (Figure 3E). These experimental findings support the predictive data demonstrating increased cleaved CASP3 (Figure 3D). In summary, SP600125 enhances UA-induced apoptosis and inhibition of cell proliferation, both of which are only modestly affected by UA alone.
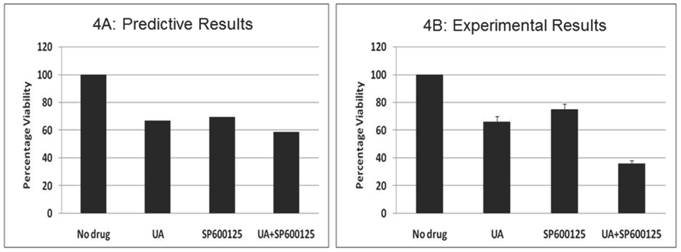
Prospective validation of the predictive combination in multiple myeloma OPM2 cells. We also tested the effect of this combination therapy in the multiple myeloma (MM) cell line OPM2, which harbors KRAS and PTEN mutations. We assayed the proliferation phenotype using the MTT assay after treatment for 48 hours (Figure 4). Similar to data observed in HCT116, the combination of 7.5 μM UA and 10 μM SP600125 displayed enhanced reduction of proliferation. Cellular proliferation was reduced by 34% with 7.5 μM UA and 25% with 10 μM SP600125. When used in combination, cellular proliferation was synergistically reduced by 64%. In addition, the anti-proliferative effects of the combination were further confirmed by Western blotting. UA and SP600125 in combination reduced the expression of cyclin D1 (Additional File 1: Supplementary Figure 3A). Enhanced apoptotic induction was also observed based on the reduction of pro-caspase 3 by combination treatment (Additional File 1: Supplementary Figure 3A).
The effect of UA and SP600125 on OPM2 cell proliferation. The data represent the correlation between the predictive simulation data (panel A) and experimental assessment of OPM2 cell viability as measured by a tetrazolium dye reduction assay (Panel B). OPM2 cells were treated with UA (7.5 uM) and SP600125 (10 uM) alone and in combination. For panel B, bars represent the mean of 3 independent experiments. Error bars indicate the standard error of the mean (SEM).
To further explore the anti-proliferative effects of combination treatment, we assessed the activation of c-Jun, a component of the transcription factor activator protein-1 (AP-1). AP-1 regulates cellular proliferation by controlling cyclin D1 expression. JNK regulates the transcriptional activity of c-Jun via phosphorylation at Ser73. Indeed, reduced c-Jun phosphorylation at Ser73 was observed upon treatment with UA and SP600125, thereby suggesting that the combination potentially reduces cell proliferation by inhibiting phosphorylation of the JNK substrate c-Jun (Additional File 1: Supplementary Figure 3A).
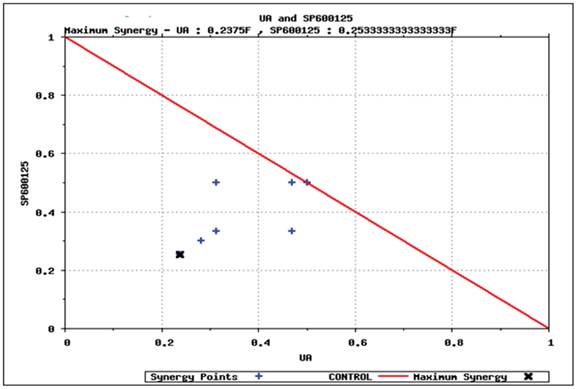
Predictive identification of synergy. We simulated various dosages of UA and SP600125 in combination to identify the minimum concentration that could achieve at least 40% reduction in viability. The results from these simulation studies are plotted in the isobologram shown in Figure 5. The minimum concentration of UA or SP600125 alone that reduced viability by 40% (i.e., IC40 viability concentration) was normalized to 1 on the x- and y-axis, respectively. Various dosing combinations that are predicted to achieve a 40% reduction in viability are indicated with blue crosses. The combination using the minimum concentration of each drug that achieved a greater than 40% reduction in viability is shown by the black arrow in the isobologram plot [17,18,19,20]. To achieve 40% reduction in viability using the lowest concentrations of the single agents for the combination treatment, the starting IC40 concentrations of the individual drugs was reduced to 1/4th of the SP600125 concentration and less than 1/4th of the UA concentration. These results suggest that these drugs interact synergistically to inhibit cellular viability in OPM2 cells. Also, it is important to note that reduced concentrations of the individual drugs can be used to achieve an enhanced efficacy, thereby increasing the therapeutic potential of the combination therapy and reducing toxicity.
Predictive simulation results on the effect of UA and SP600125 on HCT116 cell viability as shown by isobologram. The drug concentration that reduces viability by 40% has been normalized to 1. SP600125 is plotted on the Y-axis, and ursolic acid (UA) is plotted on the X-axis. The drug dosing combinations that display synergy are found under the isobol (indicated by the red line).
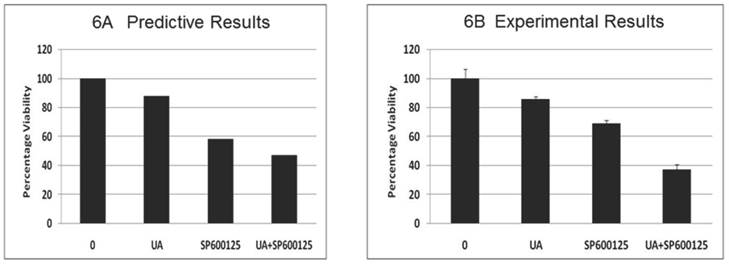
Toxicity analysis of the combination: The effect of the combination (7.5 μM UA and 10 μM SP600125) was subsequently tested on stromal fibroblast cells, resulting in a significant reduction in fibroblast viability (Figure 6A). These results are possibly indicative of potential adverse effects of the combination despite reduced individual drug doses. This predicted effect on fibroblast was tested experimentally in mouse embryonic fibroblast cells (MEF) and revealed a significant reduction in viability confirming the predictive results (Figure 6B). The reduction of viability was further confirmed by Western blotting. As shown in Additional File 1: Supplementary Figure 3B, combination treatment results in reduced expression of pro-caspase 3 and cyclin D1. These results highlight the additional facets and advantage of using the predictive technology to obtain insight into possible therapy toxicities despite its high efficacy on the disease endpoints.
Predictive simulation results on the effect of UA and SP600125 on the viability of virtual fibroblast cells (panel A) and experimental data on mouse embryonic fibroblasts (MEF) cells (panel B). For panel B, bars represent the mean of 3 independent experiments. Error bars indicate SEM.
Discussion
The Holy Grail for cancer therapy is still being pursued with earnest, and many challenges for identifying optimal treatments remain. Tumor personalization based on patient-specific mutations allows for rational drug regimen design. Despite significant advances made by targeted therapies in the treatment of cancer, clinical evidence suggests that individual drugs impacting single pathways have been largely unsuccessful given the fact that resistance typically develops [21-22]. Considerable efforts have sought to determine the mechanism by which resistance arises given the dynamic nature of the continuously evolving tumor cell. Often, the cell acquires new mutations that render the cell insensitive to the drug or parallel pathways are activated upon inhibition of a key driver pathway. Therefore, a multi-prong attack via a multi-targeted biological mechanism using drug combinations is now recognized as an effective means to address the challenges of drug resistance. This approach can be achieved by designing and testing novel combinations of molecularly targeted drugs in pre-clinical and ex-vivo patient samples.
In this study we use a predictive simulation-based approach to identify an effective therapeutic. Here, we report that UA in combination with the pan-JNK inhibitor SP600125 synergistically impacts key cancer phenotypes including proliferation and viability. This combination was identified from predictive studies conducted across various tumor cell line simulation models. The predictions were prospectively validated, and the synergistic effect of this novel mechanism was confirmed in vitro.
Of the simulation studies various agent combinations, the pan-JNK inhibitor SP600125 best enhanced the efficacy of UA. This combination was shortlisted and prospectively tested in vitro in HCT116 and OPM2 cell lines. The combination of UA with SP600125 significantly decreased proliferation and viability and promoted apoptosis, thereby enhancing the anti-tumor efficacy of UA. The combination showed significant efficacy at lower concentrations compared with the individual drugs. The combination had enhanced effects on markers of apoptosis and proliferation, such as CASP3, c-MYC and cyclin D1 (Figure 3D, E). The isobologram plot (Figure 5) predicts synergy of lower drug doses in combination, thereby increasing the therapeutic window.
The analysis of the designed therapy displays synergistic activity based on detailed network analysis. UA is an inhibitor of NFκB activity. NFκB is a transcription factor that transcribes various genes including survival genes such as BIRC5; anti-apoptotic genes such as BCL2, XIAP, and BCLXL; and angiogenic genes such as VEGFA. The primary impact of UA as a single agent was observed in the apoptosis phenotype as evidenced by activation of CASP3. UA alone had little effect on cellular proliferation.
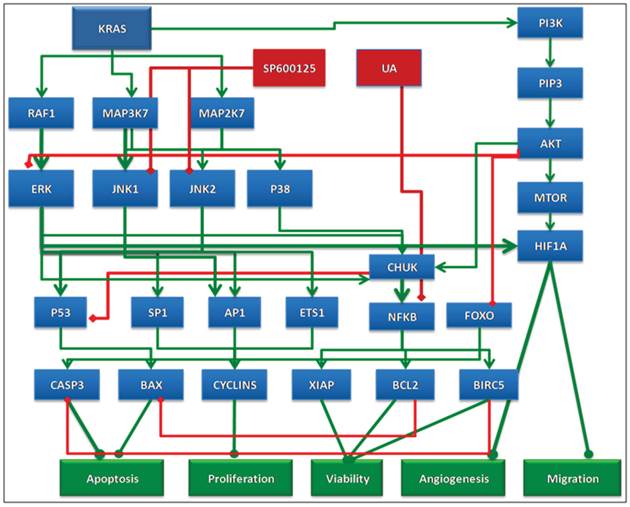
On the other hand, SP600125 is an inhibitor of JNK isoforms. MAPK8/JNK1 and MAPK9/JNK2 activate key oncogenic transcription factors, such as AP1, ATF2, ELK1, and SP1. These transcription factors regulate tumor cell proliferation via transcriptional increases in the expression of genes involved in cell cycle regulation. Hence, inhibition of JNK1 and JNK2 by SP600125 reduces the expression of these transcription factors and cell cycle genes, thereby reducing cell proliferation. When used in combination, these drugs simultaneously reduce survival and proliferation and enhance the anti-tumor potential of either agent alone. However, it is important to note that inhibition of JNK isoforms by SP600125 alone also decreases pro-apoptotic proteins, such as Bim, and could potentially hinder the induction of apoptosis [23]. However, this effect was predicted to be counteracted when SP600125 is used in combination with UA, resulting in reduced BCL2 expression and Bim activation (Figure 7).
Schematic representation of the rationale behind the selected combination. UA alone effects cell viability via NFKB but does not impact proliferation end points. The action of UA is complemented by SP600125 in combination, which impacts proliferation end points and also enhances the effect of UA on viability.
In summary, the results confirm that the combination UA with the pan JNK inhibitor SP600125 results in enhanced anti-tumor efficacy through simultaneous activation of apoptosis and inhibition of proliferation via the inhibition of transcription factors, such as AP1 and SP1, which support proliferation. Indeed, the combination reduces the activation of c-Jun, a component of AP-1, as indicated by reduced phosphorylation at Ser73 (Additional File 1: Supplementary Figure 3A).
The designed therapy was screened via simulation in stromal fibroblast cells. The combination displayed a significant reduction in fibroblasts cell viability. These results indicate potentially adverse effects of this combination on fibroblasts cells despite reduced individual drug doses (Figure 6A). This predicted effect was tested experimentally in MEF cells and revealed a significant reduction in viability, confirming the predicted results (Figure 6B).
Based on predictive and experimental data, the combination of UA and SP600125 displays potentially deleterious effects on control fibroblast and endothelial cell viability. This highlights another key facet of the predictive analysis, namely its ability to provide insight into early treatment issues despite favorable effects on long term-tumor endpoints. Predictions of biological toxicity using this technology would allow for the development of effective screening protocols wherein potentially toxic combinations could be eliminated from further characterization.
Supplementary Material
Additional File 1Supplementary Figures 1-3.
Competing Interests
The authors have declared that no competing interest exists.
References
1. Shanmugam M.K. et al. Ursolic acid inhibits multiple cell survival pathways leading to suppression of growth of prostate cancer xenograft in nude mice. J Mol Med (Berl). 2011;89(7):713-27
2. Liu J. Pharmacology of oleanolic acid and ursolic acid. J Ethnopharmacol. 1995;49(2):57-68
3. Liobikas J. et al. Uncoupling and antioxidant effects of ursolic acid in isolated rat heart mitochondria. J Nat Prod. 2011;74(7):1640-4
4. Kassi E. et al. Ursolic acid, a naturally occurring triterpenoid, demonstrates anticancer activity on human prostate cancer cells. J Cancer Res Clin Oncol. 2007;133(7):493-500
5. Pathak A.K. et al. Ursolic acid inhibits STAT3 activation pathway leading to suppression of proliferation and chemosensitization of human multiple myeloma cells. Mol Cancer Res. 2007;5(9):943-55
6. Manu K.A, Kuttan G. Ursolic acid induces apoptosis by activating p53 and caspase-3 gene expressions and suppressing NF-kappaB mediated activation of bcl-2 in B16F-10 melanoma cells. Int Immunopharmacol. 2008;8(7):974-81
7. Kassi E. et al. Ursolic acid triggers apoptosis and Bcl-2 downregulation in MCF-7 breast cancer cells. Cancer Invest. 2009;27(7):723-33
8. Kiran M.S. et al. Modulation of angiogenic factors by ursolic acid. Biochem Biophys Res Commun. 2008;371(3):556-60
9. Vali S. et al. Virtual prototyping study shows increased ATPase activity of Hsp90 to be the key determinant of cancer phenotype. Syst Synth Biol. 2010;4(1):25-33
10. Roy K.R. et al. Celecoxib inhibits MDR1 expression through COX-2-dependent mechanism in human hepatocellular carcinoma (HepG2) cell line. Cancer Chemother Pharmacol. 2010;65(5):903-11
11. Cirstea D. et al. Dual inhibition of akt/mammalian target of rapamycin pathway by nanoparticle albumin-bound-rapamycin and perifosine induces antitumor activity in multiple myeloma. Mol Cancer Ther. 2010;9(4):963-75
12. Rajendran P. et al. Suppression of signal transducer and activator of tran-scription 3 activation by butein inhibits growth of human hepatocellular carcinoma in vivo. Clin Cancer Res. 2011;17(6):1425-39
13. Manu K.A. et al. Plumbagin inhibits invasion and migration of breast and gastric cancer cells by downregulating the expression of chemokine receptor CXCR4. Mol Cancer. 2011;10:107
14. Tandon R. et al. Dual epidermal growth factor receptor (EGFR)/insulin-like growth factor-1 receptor (IGF-1R) inhibitor: a novel approach for overcoming resistance in anticancer treatment. Eur J Pharmacol. 2011;667(1-3):56-65
15. Kannaiyan R. et al. Celastrol inhibits proliferation and induces chemosensitization through down-regulation of NF-kappaB and STAT3 regulated gene products in multiple myeloma cells. Br J Pharmacol. 2011;164(5):1506-21
16. Rajendran P. et al. Honokiol inhibits signal transducer and activator of transcription-3 signaling, proliferation, and survival of hepatocellular carcinoma cells via the protein tyrosine phosphatase SHP-1. J Cell Physiol. 2012;227(5):2184-95
17. Li Y. et al. Enhancement of chemotherapeutic agent-induced apoptosis by inhibition of NF-kappaB using ursolic acid. Int J Cancer. 2010;127(2):462-73
18. Shishodia S. et al. Ursolic acid inhibits nuclear factor-kappaB activation induced by carcinogenic agents through suppression of IkappaBalpha kinase and p65 phosphorylation: correlation with down-regulation of cyclooxygen-ase 2, matrix metalloproteinase 9, and cyclin D1. Cancer Res. 2003;63(15):4375-83
19. Bhutani M. et al. Capsaicin is a novel blocker of constitutive and interleu-kin-6-inducible STAT3 activation. Clin Cancer Res. 2007;13(10):3024-32
20. Kajstura M. et al. Discontinuous fragmentation of nuclear DNA during apoptosis revealed by discrete "sub-G1" peaks on DNA content histograms. Cytometry A. 2007;71(3):125-31
21. Rosenzweig S.A. Acquired resistance to drugs targeting receptor tyrosine kinases. Biochem Pharmacol. 2012;83(8):1041-8
22. Porcelli L. et al. Synergistic antiproliferative and antiangiogenic effects of EGFR and mTOR inhibitors. Curr Pharm Des. 2013;19(5):918-26
23. Guan Q.H. et al. Neuroprotection against ischemic brain injury by SP600125 via suppressing the extrinsic and intrinsic pathways of apoptosis. Brain Res. 2006;1092(1):36-46
Author contact
![]() Corresponding author: Nicole Doudican, NYU School of Medicine, 522 1st Avenue, Smilow 407, New York, NY, 10016. Phone: 212-263-9077; Fax: 212-263-5817; E-mail: nicole.doudicanorg
Corresponding author: Nicole Doudican, NYU School of Medicine, 522 1st Avenue, Smilow 407, New York, NY, 10016. Phone: 212-263-9077; Fax: 212-263-5817; E-mail: nicole.doudicanorg