Impact Factor ISSN: 1837-9664

 Global reach, higher impact
J Cancer 2011; 2:490-502. doi:10.7150/jca.2.490 This volume Cite
Research Paper
miRNA Alterations Modify Kinase Activation In The IGF-1 Pathway And Correlate With Colorectal Cancer Stage And Progression In Patients
David L. Knowlton ![]() , Kim Tang, Peter V. Henstock, Romesh R. Subramanian
, Kim Tang, Peter V. Henstock, Romesh R. Subramanian
Pfizer Inc., 620 Memorial Dr. Cambridge, MA. 02139, USA
Received 2011-7-19; Accepted 2011-9-21; Published 2011-10-1
Abstract
Investigation of therapy naïve human tumor and adjacent normal tissue biopsies demonstrated that expression levels of miRNAs are altered at and between stages of CRC. Targets of these altered miRNAs are members of the Insulin signaling pathways. Phosphorylation states of several molecules in the Insulin signaling pathways were altered between stages of CRC, and significantly the change in molecular phosphorylation state correlated with decreases in specific miRNAs that target them. This data establishes a direct relationship between decreased expression of specific miRNAs and increased phosphorylation events in the IGF-1 pathway and identifies the IGF-1 pathway as a critical driver of colorectal cancer.
The expression levels of 319 miRNAs and phosphorylation levels of major signaling proteins were determined. Interestingly, we observed that miRNAs were altered in expression and several signaling molecules were altered in phosphorylation levels at and between each stage of CRC. Furthermore, many of the miRNAs that are differentially expressed at each CRC stage were targeting these same signaling proteins identified to be altered in phosphorylation level. Thus, our studies define a subset of important miRNAs to classify CRC stage and a relationship between miRNA depression and elevated phosphorylation of IGF-1R pathway signaling molecules.
Keywords: miRNA, IGF-1R pathway, Phosphorylation events, and Colorectal cancer.
Introduction
Colorectal cancer has been identified as the cause of more than 50,000 deaths annually in the US alone and greater than 100,000 new cases will be diagnosed in 2010 according to the National Cancer Institute. Within the past two decades several signaling pathways have been identified to be dysregulated in CRC and within the last 10 years, several miRNAs have been demonstrated to be biomarkers for the presence of disease. However to date, correlation of miRNAs with CRC stage is lacking. Since CRC progresses in distinctive stages, we hypothesized that differences in miRNA expression might exist that would better define CRC stage and delineate the importance of dysregulated events.
All cancers ultimately result from the deregulation of genetic systems and one of the most powerful influences of these systems to have been uncovered within the past 10 years has been miRNAs. A brief scan of the literature reveals greater than 3000 publications curated within NCBI on the association of Cancer and miRNAs. As our understanding of miRNAs increases we postulate that miRNAs may serve not only as an indicator of CRC but also as a direct effector of CRC.
MiRNAs are short 19 - 25 nucleotide stretches of RNA that base pair with mRNA to form complexes prior to protein translation and thus halt the expression of proteins. miRNAs start as pre-miRNA in the nucleus and are cleaved in the cytosol into functional miRNA by Dicer. miRNAs then interact with target mRNA via interaction with Argonaute 2 and GW-182 [1]. The final fate of the mRNA, i.e. degradation or sequestration, is dependent upon factors that are still being elucidated. In either case mRNA translation is ultimately arrested.
Colorectal cancer begins with the unregulated cellular growth of aberrant crypt foci in the colon or rectum and progresses through four stages of development. Stage I is classified as cancer in the mucosa and submucosa of the colon or rectum wall. At Stage II the cancer has progressed through the muscle layer and may have spread to nearby organs. Stage III is characterized with cancer spreading to the lymph nodes and Stage IV has been reached once the cancer has metastasized throughout the body.
Signaling pathways of CRC show a high degree of crosstalk and incorporate multiple negative feedback controls. Important molecules in these pathways have been shown to be altered in phosphorylation state in CRC and these events can be explained by their roles in cell growth, differentiation, metabolism, and metastasis [2,3,4,5,6,7]. Correlation of miRNA alterations with molecular signaling has been described in vitro and in vivo; however this relationship has not been thoroughly explored in human patient tumors.
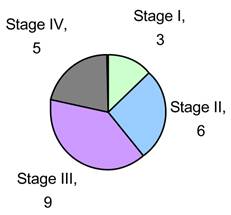
We obtained Tumor and Normal adjacent tissue of 23 CRC patients (see Fig. 1) who were therapy naïve from Indivumed of Hamburg, Germany. All samples were obtained within 5 minutes of excision and flash frozen for storage and transport. All patient information was kept confidential in keeping with Pfizer HIPAA protocol. Each patient's consent was obtained by Indivumed. Our research indicates that there is a strong correlation between alterations in a few miRNAs and CRC stage and progression. We also identify that kinases that activate members of the IGF-1 pathways are significantly phosphorylated and this activation correlates with miRNA status.
Sample Population by Stage
Materials and Methods
RNA isolation
All RNA samples were prepared from 50mg of CRC tumor fragments. Tissue homogenization was performed in Qiazol (Qiagen) and extracted with Chloroform. Total RNA was isolated with miRNEasy kit (Qiagen) and assessed for quality with qRT-PCR.
qRT-PCR
10ng of Total RNA was reverse transcribed with ABI's TaqMan® miRNA reverse transcription kit (ABI part number 4366597). Briefly, miRNA specific stem loop primers are extended in the presence of total RNA for first strand synthesis. Following first strand synthesis, TaqMan® probes were used in real time PCR for total RNA quality assessment. sn/snoRNAs; RNU24, RNU48 and RNU49 (ABI part numbers 4373379, 4373376 & 4373383 respectively) were utilized to compare freshly isolated RNA from commercially available Total Distal Colon RNA (ABI part number AM6836) for relative expression levels.
Real time PCR was performed with TaqMan® 2x PCR Mastermix, No AmpErase® UNGase (ABI part number 4324018).
Luminex FlexmiR Human panel Assay
Built upon capture bead technology; the assay is designed to measure miRNA abundance in a multiplex format by first identifying the capture bead type and then the amount of miRNA captured. This is achieved through fluorescent illumination of the capture beads after hybridization with the total RNA sample.
miRNA targets are captured by LNA (Locked Nucleic acid) probes attached to the bead and multiple copies of only one miRNA target may be captured per bead.
Samples are first enzymatically biotinylated and then combined with the capture beads for hybridization. The captured biotinylated miRNA are treated with a Streptadvidin-PE conjugate for fluorescent labeling before measuring miRNA levels. Measurements were made with the BioPlex 200. Capture bead dye ratios were measured to determine miRNA target specificity (thus gating) and then a PE fluorescent intensity was measured for relative abundance per bead. Normalization of relative abundance was achieved through the inclusion of 4 snoRNA capture beads per multiplexed sample.
Protocol was performed per manufacturer's instructions (Luminex part numbers: FlexmiR Human miRNA panel kit; BG-FMIR-H20-8.0 and Labeling kit BG-FMIR-L50). In brief, 2.5ug of each sample was analyzed for 319 miRNAs and 4 snoRNAs. The BioPlex 200 instrument was calibrated and validated prior to each assay run per manufacturer's instructions.
BioRad 17plex Phosphoprotein detection Assay
To detect the phosphorylation states of multiple kinases simultaneously we utilized the BioRad 17-plex capture bead-based technology. Measurements were made on the BioPlex200. Phosphorylation of analytes detected in this assay are as follows;
p-Akt (Ser473), p-ATF-2 (Thr71), p-ERK1/2 (Thr202/Tyr204, Thr185/Tyr187), p-GSK3Α/β(Ser21/Ser9), p-Histone H3 (Ser10), p-HSP27 (Ser78), p-IGF-IR (Tyr1131), p-IRS-1 (Ser636/Ser639), p-JNK (Thr183/Tyr185), p-MEK1 (Ser217/Ser221), p-PDGF Receptor β (Tyr751), p-p38 MAPK (Thr180/Tyr182), p-p53 (Ser15), p-p70 S6 Kinase (Thr421/Ser424), p-p90RSK (Thr359/Ser363), p-Src (Tyr416), p-Stat3 (Tyr705)
Samples were lysed according to Bio-Plex Phospho 17-Plex Assay procedures (Bio-Rad Cat# X70SMXL3DU and Document # 4110018 Rev C). Sample protein levels were determined by Pierce BCA assay levels and diluted to 500ug/ml each. 25ul of each sample lysate and assay controls were measured.
Results
Alterations in miRNA expression
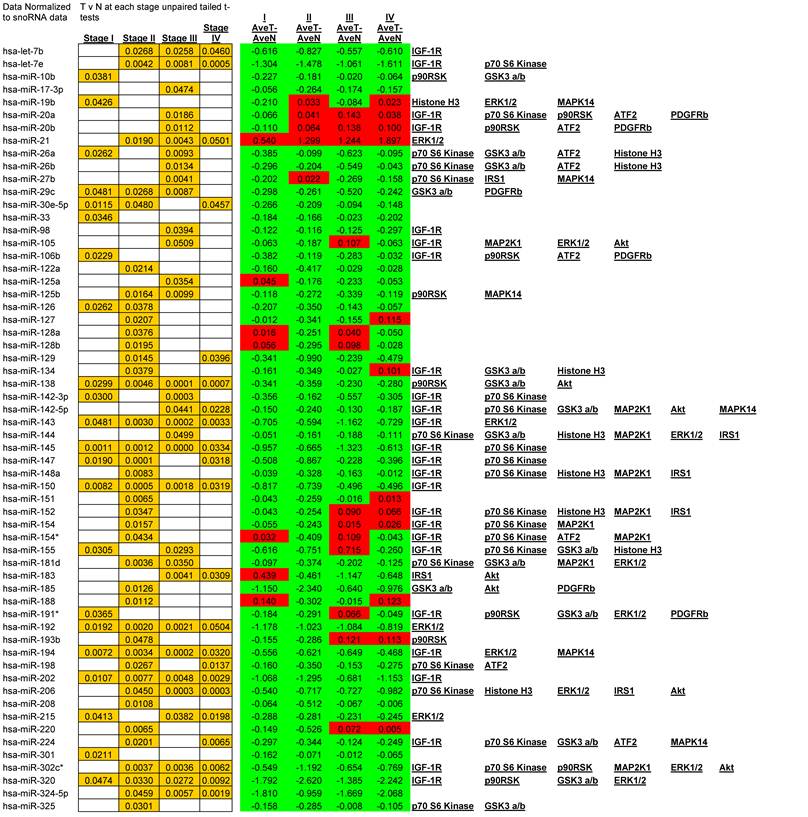
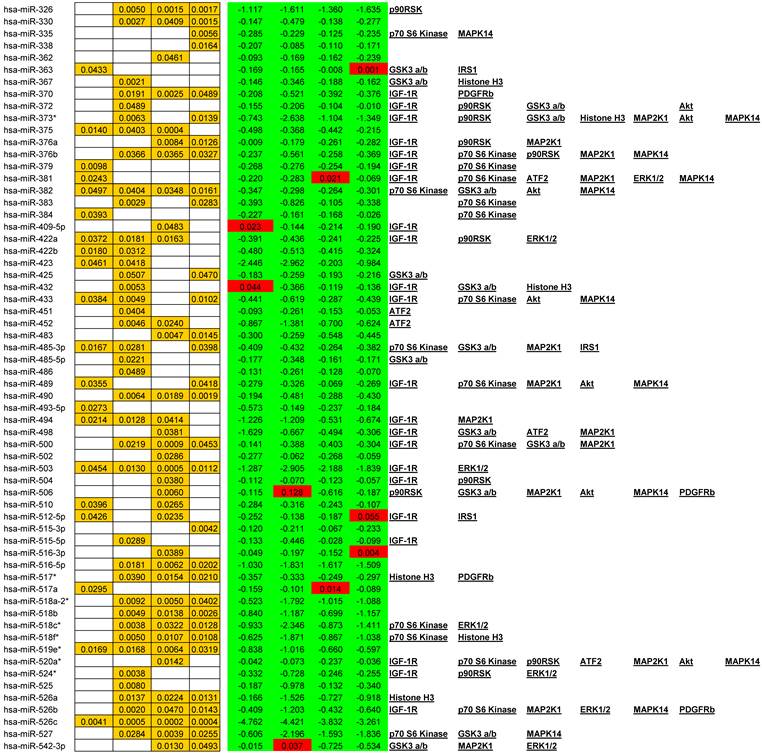
We observed alterations in expression levels of 130 miRNAs when comparing Tumor to Normal levels at and between stages of CRC. (See Table 1 for expression profiles). Only significant data are reported and all are based upon unpaired t-tests with significance assigned by p <0.05. Several miRNAs showed dysregulation at multiple stages when compared to their normal expression level. Let-7b, Let-7e, 206, 302c*, 324-5p26, 330, 370, 376b, 490, 500, 516-5p, 517*, 518a-2*, 518b, 518c*, 518f*, 526a, 526b, and 527 were all down regulated at stages II, III, and IV whereas only miR-21 was significantly up regulated at stages II, III, and IV. A smaller subset of 12 miRNAs were depressed in tumor expression levels at all stages of CRC; miRNAs 138, 143, 145, 150, 192, 194, 202, 320, 382, 503, 519e*, and 526c. Comparisons between each stage revealed that in most instances with the progression of CRC stage few significant alterations were observed although significant changes were observed when comparing tumor to adjacent normal tissue. The significant finding was that the majority of altered miRNAs targeted critical signaling nodes in the Insulin signaling pathway.
Significant alteration of miRNA in CRC. Unpaired t-tests p-values < 0.05 reported in gold, Average tumor levels - Average Normal levels at each stage in red (increasing) and green (decreasing) and their respective targets in the IGF-1R signaling pathway.
IGF-1 plays a role in CRC and studies show [8] a correlation between certain SNPs in IRS-1 and CRC [9]. We investigated the signaling events that would better delineate the role of IGF-1R signaling in CRC. To this end we analyzed 17 signaling molecules known to be associated with oncogenesis and the IGF-1R signaling pathway from 23 patients at different CRC stages who were naïve for cancer therapies.
Phosphorylation states of signaling molecules across CRC stage and correlations to miRNA alterations
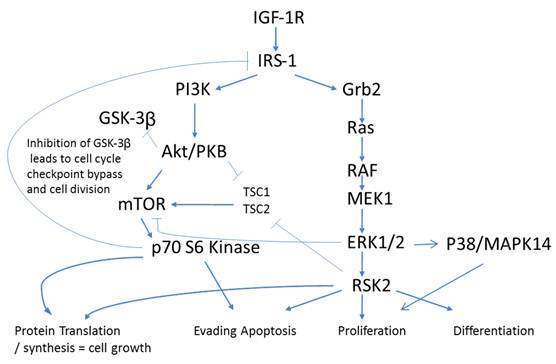
An antecedent of Insulin signaling is ligand binding to the IGF-1 receptor. IGF-1R is a tetrameric transmembrane protein of the Insulin family of receptors. Upon binding of Insulin, IGF-1 or IGF-2 to the IGF-1 receptor, a signaling cascade is put in motion resulting in increased gene activation, cell cycle progression, cell growth, differentiation, and an anti-apoptotic effect. These events follow two distinct arms of signaling pathways with crosstalk and negative feedback loops creating a complex network of communication within the cell. Down one arm is the PI3K/Akt pathway and down the other is the Ras/MAPK pathway (Fig. 2).
Phosphorylation pathways adapted from KEGG (50)(51). Cross talk of IGF-1R in Colorectal cancer. Closed arrows - activation via phosphorylation, Open arrows -inhibition via phosphorylation.
IGF-IR
IGF-1 and IGF-II are two principal ligands of the IGF-1R and both have been shown to be upregulated in cancer [10] thus affecting proliferation, differentiation, and metastasis. Upon ligand binding, IGF-1R undergoes autophosphorylation of three critical tyrosine residues; Y1131, 1135, & 1136. These events result in the recruitment and potential tyrosine phosphorylation of IRS-1, IRS-2, Shc, and Grb-10 all known to effect oncogenic processes [10]. Both the PI3K-Akt-mTOR and Raf-MEK-MAPK pathways are thought to be two important downstream signaling pathways regulating oncogenesis.
Each signaling cascade takes a divergent path with some cross talk evident. We found several of these signaling proteins to be altered in phosphorylation level between stages of CRC. We measured Y1131 phosphorylation of IGF-1R as an indication of receptor activation.
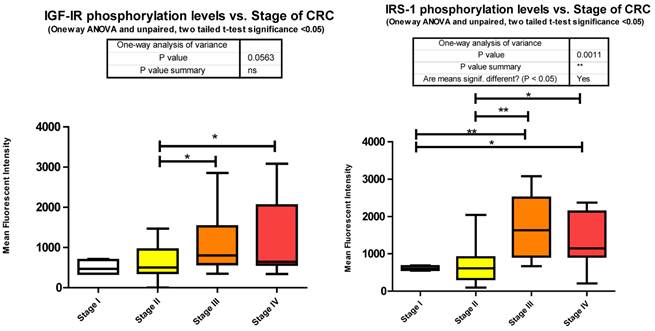
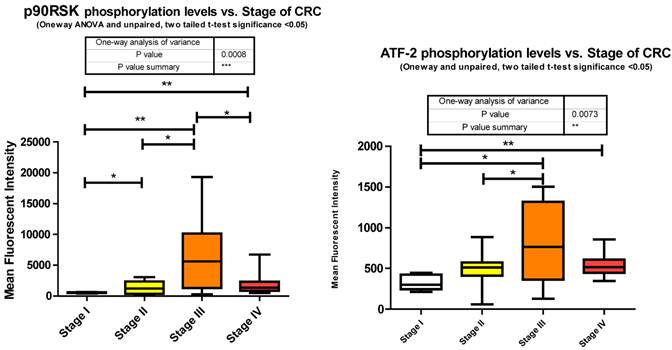
Our data shows that as the stage of CRC progresses there is a significant increase from stages II to III and stage II to IV in Y1131 phosphorylation (Fig. 3).
Phosphorylation events in the IGF-1R signaling pathway of CRC tumor samples. One Way ANOVA significance reported as P<0.05 and unpaired t-tests to delineate significant alterations, p< 0.05 between stages of CRC.
In colon tissue the over-expression of IGF-IR in tumor vs. normal is striking [11] since under normal physiological conditions the expression and activation of IGF-IR is tightly controlled.
miRanda, a miRNA target prediction algorithm employed through the online resource microRNA.org [12,13,14,15], identifies 254 miRNAs to potentially target IGF-1R.We measured a total of 102 of these miRNAs. Within our data set 47 of these miRNA are significantly altered in expression. (See Table 1 for all alterations). It is notable that a correlation of depressed miRNA expression and increased signaling molecule phosphorylation is often evident and, as we will show, will be a reoccurring theme throughout our research report.
IRS-1( IRS1)
Of the signaling molecules interacting with IGF-1R, IRS-1 has been proposed to play a pivotal role in cancer [16]. Originally identified as a signaling intermediate of Insulin receptor, it is now considered one of the most prominent molecules in the PI3K/Akt arm of IGF-1R signaling. Following docking to ligand bound IGF-1R, IRS-1 may become tyrosine phosphorylated, and lead to downstream activation of several canonical (IR/IGF-1R signaling) or non canonical pathways (non IR/IGF-1R signaling; e.g. cytokines, integrins, and hormones). The docking to IR or IGF-1R and subsequent tyrosine phosphorylation of IRS-1 leads to the activation of the downstream signaling molecule, PI3K, and subsequent recruitment and phosphorylation of Akt by PDK1. The over expression of IRS-1 has been observed in numerous cancers [17] and its activation after docking to IGF-1R through Y950 recorded in only a few articles [18,19]. IRS-1 tyrosine phosphorylation was however identified in 27 of 34 different tumors in Breast Cancer [20] and in Colon cancer cell lines HT-29 [21] and CT-26 [22]. In each study tyrosine phosphorylation was measured by pan tyrosine Abs. However there are several phosphorylation sites on IRS-1 and not all are activation signals. Phosphorylation of Serines 636/639 by mTOR [23] and through a p70 S6 kinase mediated mechanism [24,25] leads to IRS-1 inactivation. We measured S636/639 phosphorylation and found it to be increasing from stages I to III, I to IV, II to III, and II to IV (Fig. 3).
Much research has identified a negative feedback system in the PI3K/Akt pathway [26]. This negative feedback involves the action of mTORC1, downstream of Akt. Upon phosphorylation of mTORC1 it in turn phosphorylates p70 S6 kinase resulting in RPS6 activation and increased protein translation. However an alternate event, p70 S6 kinase phosphorylation of IRS-1 on S636/639, could also occur resulting in decreased IGF-1R signaling.
We observe a significant increase across the stages of CRC in Serine 636/639 phosphorylation (Fig. 3), which as stated before is an inhibitory signal. This is not to say that all downstream signaling has been entirely inhibited, but that as CRC progresses the negative feedback loops are increasingly signaling for IRS-1 to deactivate.
Given that little has been studied on the phosphorylation state of IRS-1 in CRC these results should be of great interest for future research. The negative regulation of IRS-1 is well documented [20, 27] and our data suggests that as CRC progresses the negative feedback loops regulating IRS-1 signaling are still active. As to the over expression of IRS-1 in CRC, miRanda identifies 56 miRNAs that are predicted to target IRS-1. We measured 26 and found 9 to be significantly depressed.
Akt (AKT1, AKT2, PKB)
Akt has been established as a major signaling node in numerous pathologies including cancer [28]. This is rooted in the elevated Akt levels found in tumor tissue eliciting inhibitory effects on proapoptotic signaling events, activating cell proliferation, and cell growth [29]. Akt is a serine/threonine kinase whose actions are brought about through a variety of phosphorylation sites. Initially Akt is partially activated via the IGF-1R/PI3K signaling pathway by PDK1 at T309, however it is S473 phosphorylation by mTOR and specifically the mTORC2 complex that results in maximal activation. Upon phosphorylation of S473, Akt can activate or inhibit numerous signaling molecules in colon cancer [30, 31]. Of growing importance are the signaling molecule mTOR and the signaling cascade it regulates via two very different complexes, mTORC1 and mTORC2. Akt has been shown to phosphorylate mTOR via PRAS40, a component of mTORC1. Further downstream, mTOR phosphorylates p70 S6 kinase (T389), a regulator of Ribosomal Protein S6 (RPS6) responsible for mRNA translation, and has been proposed to signal via 14-3-3 (tyrosine 3-monooxygenase), a required protein in Raf signaling, to inhibit IRS-1 in a negative feedback loop [32].
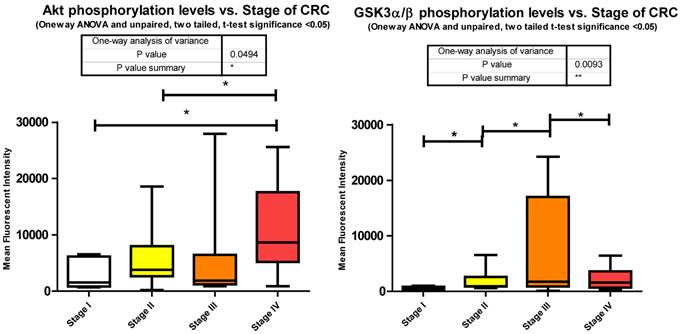
Our data shows significant increases in Akt S473 phosphorylation levels when comparing stage I to IV and stage II to IV (Fig. 3). The fact that Akt S473 phosphorylation is elevated with CRC progression is not surprising given its role in cell cycle progression, cell growth, protein synthesis, and survival. As to miRNA regulation, miRanda predicts 85 miRNAs to target Akt. We measured 33 of these miRNAs and found 14 significant decreases between tumor and normal.
GSK3α/β (GSK3A and GSK3B)
GSK3α/β is a serine/threonine kinase known to play a role in several signaling pathways including the Wnt/ β-catenin, Hedgehog, Notch, and Insulin pathways [33]. In its non-phosphorylated state it functions as a negative regulator of Glycogen synthase and eIF2B. Additionally, its phosphorylation of the β-catenin/axin/APC complex results in the stabilization of axin, targeting of β-catenin for ubiquitination, and subsequent negative regulation of gene expression.
GKS3α/β has multiple phosphorylation sites and among these are S9 (β) & S21 (α). Upon their phosphorylation, GSK3α/β becomes inactive leading to the activation of Glycogen synthase and eIF2B. This S9/S21 phosphorylation has been shown to act through the Insulin signaling pathway by Akt, having a variety of effects on downstream signaling [34].
Inhibition of GSK3α/β results in Glycogen synthesis, up regulation of protein synthesis by eIF2B, and gene transcription of such oncogenes as Cyclin D1. Furthermore inactivation of the Forkhead family of transcription factors and TSC2 add to GSK3α/β's role in cell growth, differentiation, and metastasis independent of β-catenin. Our data shows a significant increase in phosphorylation of S9/S21when comparing stages I - II, stages II - III, and a significant decrease between stages III - IV (Fig. 3). The increase in Akt S473 phosphorylation shown above and an increase in p70 S6 Kinase phosphorylation, to be shown later, explain the increase in S9/S21 phosphorylation of GSK3α/β but how does this contribute to CRC?
These inhibitory events between stages I to II and II to III might be explained in recent studies linking GSK3α/β to cell cycle checkpoint bypass and metastasis. In these studies GSK3α/β is reported to be inhibited in a number of tumor types. Kang et al. [35] establish that active GSK3α/β negatively regulates Cdc25a, a phosphatase important in cell cycle transition that is over expressed in a number of cancers. As GSK3α/β becomes phosphorylated and thus inactivated, Cdc25a becomes activated and unchecked. The decrease in phosphorylation between stages III to IV, although surprising, may be explained simply through the need for energy. As the progression of CRC reaches its final stages, other mechanisms engage to arrest Glycogen synthesis and free up glucose stores for an increase demand for energy brought about by increased cell growth, proliferation, and differentiation. As to miRNA expression, miRanda predicted 345 miRNAs that target GSK3α/β. We measured 81, 29 of which were all significantly depressed in CRC.
p70 S6 Kinase (RPS6KB1, S6K1)
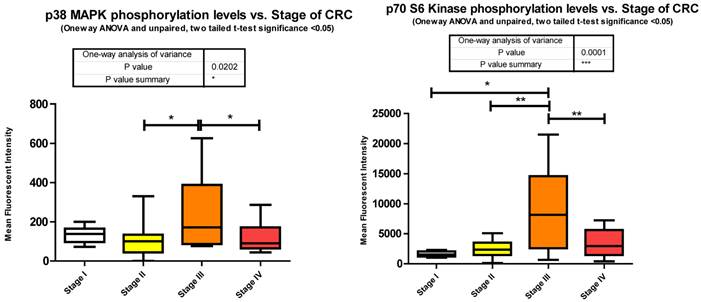
p70S6Kinase (S6K1) is a member of the Ribosomal S6 Kinase family that plays an important role in cell proliferation, cell cycle progression, cell size, and gene translation. It is well documented to be upregulated in many tissue types and markedly so in colorectal tumors [36]. The main upstream activator of p70 S6 kinase is mammalian target of rapamycin (mTOR) via the PI3K-Akt signaling pathway. It is specifically mTORC1 that has been demonstrated to interact with p70 S6 kinase, phosphorylating T421/S424 and T386 regulating various downstream responses. The most direct of these responses is its activation of RPS6 and subsequent increased protein translation. This of course results in increased proliferation, growth, and survival. However, as stated previously, p70 S6 kinase has an alternate pathway that it may orchestrate. Insulin signaling has been shown to be negatively regulated via IRS-1 inhibition as a direct result of an Akt/mTORC1/p70 S6 kinase pathway. p70 S6 kinase directly binds to and phosphorylates IRS-1 via two different serine residues, S1101 and S270. Upon binding, IRS-1 activity has been shown to be decreased, which is associated with an increase in S636 phosphorylation of IRS-1. Our data shows that p70 S6 kinase is also significantly increasing in its phosphorylation state across stages I to III, and II to III, but decreasing between stages III to IV (Fig. 3). Given the interaction of p70 S6 kinase and IRS-1, this data strengthens our argument that the negative regulation of insulin signaling in CRC remains intact. The increases observed between stages I to III and II to III are in good agreement with the above argument however the decrease observed between stages III to IV require further consideration. What is striking is that molecules known to be interacting within the Insulin signaling pathway are phosphorylated in accordance with each other. As we observe the increases in p70S6 kinase and highlight the inhibition of IRS-1 we see an appropriate increase in IRS-1 S636 phosphorylation and as we observe a decrease in p70S6 kinases between stages III to IV we also see, albeit not significant, a decrease in IRS-1 phosphorylation between the same stages. An argument could be made where there is a switch that is engaged at the later stages of CRC where negative regulation of the IGF-1R pathway is no longer supported and evasion of apoptosis and increased protein translation are forgone for an increase in cell growth and differentiation. (See Fig. 2)
To further complicate matters Julien et al [37]. suggests an even more intriguing role for p70 S6 kinase. They propose that the activation of p70 S6 kinase via mTORC1 results in the phosphorylation of Rictor, a component of mTORC2, on T1135 and this in turn signals increased Akt and GSK3α/β phosphorylation.
Thus, in Julien et al.'s research [37] we not only have a novel interplay between mTORC1 and mTORC2 but we also have a plausible explanation for our results of increased Akt phosphorylation and GSK3α/β. In our miRNA analysis we show that decreased expression of 36 miRNAs, predicted by miRanda to target p70 S6 kinase, reasonably explains at least in part the over expression of p70 S6 kinase in CRC and plausibly its excessive phosphorylation.
Overall miRanda predicts 262 miRNAs that target p70 S6 kinase. We measured 114, finding 37 significantly altered.
MEK1 (MAP2K1)
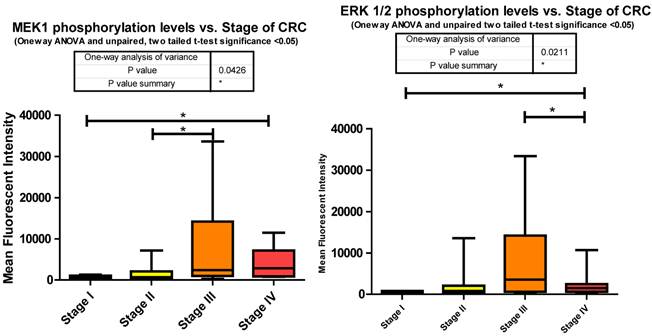
MEK1 or Mitogen-activated protein kinase kinase 1 is a Threonine/Tyrosine kinase member of the Ras oncogene signaling pathway. Ras becomes activated via IGF-1R signaling through SHC, an alternate intermediate signaling molecule that docks to IGF-1Rs activation loop via its PTB domain. Upon phosphorylation of SHC, recruitment of Grb2 and SOS lead to the activation of Ras followed by subsequent activation of Raf. It is Raf that activates MEK1 through phosphorylation of S217/S221. This activation leads to further downstream signaling that regulates cell proliferation, differentiation, and growth [38]. Our data shows significant increases in phosphorylation when comparing stages I to IV and II to III. (Fig. 3)
As for the miRNA, miRanda predicts that 194 miRNAs target MEK1. We measured 54 and observed that 21 were down regulated with CRC progression. The increase in MEK1 phosphorylation with the advancement of CRC is not surprising given the role of MEK1 in the MAPK cascade and together these two pieces of data provide further implication as to the inverse relationship of miRNA to phosphorylation events.
ERK1/2 (MAPK3/MAPK1)
Extracellular signal related kinases 1 and 2, also known as MAPK3 and 1 respectively, are critical molecules in the Mitogen-activated kinase cascade. Together these two proteins are responsible for mediating the MAPK signaling cascade and the phosphorylation of a host of transcription factors such as Elk1, CREB, and c-myc. They also activate further downstream signaling molecules leading to the activation of p90RSK, JNK, and p38 MAPK, regulating cell growth, differentiation, motility, and cytoskeleton remodeling.
The significant increase between stages I to III is expected given the multiple roles it plays in cellular signaling whereas the significant decrease between stages III to IV was surprising. This decrease however suggests that in later stages of CRC this pathway is being placed in check somehow. Reviewing the miRNA responsible for regulating ERK1/2 in our data set informs us that the only mRNA that is targeted by miR-21 is ERK1/2. Our data shows that miR-21 is consistently increased compared to normal tissues at stages II, III, and IV. Given the evidence we have so far shown regarding the number of miRNA depressed resulting in an increased phosphorylation of their targeted signaling molecules it is interesting to propose that here miR-21's elevation may be responsible for the decreased phosphorylation of ERK1/2 from stages III to IV (Fig. 3).
Overall miRanda predicts a total of 249 miRNA target ERK1/2 (MAPK3 and MAPK1 combined) where we measured 58 and observed 20 to be altered. 11 of these were significantly depressed at stage IV, miR-21 significantly elevated, and the remaining 8 unaltered at stage IV when compared to normal levels.
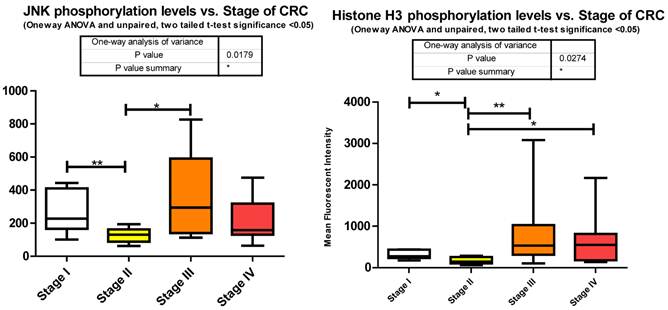
JNK (MAPK8)
c-jun N-terminal kinase 1, another member of the MAPK cascade is directly phosphorylated by ERK1/2 to activate a number of downstream transcription factors regulating protein translation. We observed a significant decrease between stages I to II followed by a significant increase between stages II to III of T183/Y185 phosphorylation (Fig. 3). We did not measure any miRNA predicted by miRanda to target JNK.
p38 MAPK (MAPK14)
p38 MAPK also known as MAPK14, is also, as its name implies, a member of the MAPK cascade of signaling molecules. It too is responsible for the regulation of cell cycle and proliferation. It is activated via direct phosphorylation of T180/Y182 by ERK1/2 and exerts its effects through direct interaction with transcription factors like ATF2, cell cycle regulators like Cdc25b, and tumor suppressors like p53. We observe a significant increase in T180/Y182 phosphorylation between stages II to III followed by a significant decrease from stages III to IV (Fig. 3). (Of interest, no significant alterations were observed across CRC stage for p53) p38's (MAPK14) role in Insulin signaling is still quite poorly understood however it has been linked to IGF-1's antiapoptotic regulation [39]. Thus our data is again in agreement with our argument of a pathway switching from antiapoptotic and increased protein translation in the earlier stages of CRC to more growth and differentiation in the later stages of CRC. As seen with IRS-1, GSK3α/β, p70 S6 kinase, and p90RSK, an initial increase in phosphorylation directs IGF-1 signaling (see Fig. 2) toward increased protein synthesis and antiapoptotic mechanisms with the onset of CRC and as the pathology progresses a switching of pathway mechanism occurs which is evident by the decreased phosphorylation of these same signaling molecules toward growth and differentiation mechanisms.
ATF2
Activating transcription factor 2 is a transcription factor that upon phosphorylation of T69 and T71 is capable of both homo- and hetero-dimerization with family members of the Jun/Fos regulators. This range of interactions affords ATF2 roles in cell cycle regulation, growth, differentiation, and apoptosis.
The exact nature of signaling events in CRC is poorly defined however it has been demonstrated that it is dependent on ERK, JNK, and p38 MAPK [40]. Within our study we observed each; ERK, JNK, and p38 MAPK to be significantly increasing with CRC stage. Both JNK and p38 MAPK increase significantly between stages II to III and ERK increasing significantly from stages I to IV. Both ERK and p38 MAPK are decreasing significantly between stages III to IV with a trending (unpaired t-test, p = 0.07) decrease observed for JNK between III to IV (Fig. 3). Our data is only looking at T71 phosphorylation however it has been previously shown in CRC that both T69 and T71 are phosphorylated through these mechanisms [41]. What we have delineated is the specific stage at which these events occur.
miRanda predicts that 162 miRNA target ATF2 and we measured 46 of these. Of these 46 we observed 13 significant alterations where 2 were increasing at stage III and the remainder significantly decreasing at various stages of CRC.
p90RSK (RPS6KA1, RSK1)
p90RSK (RSK1) is a member of the Ribosomal S6 kinase family with roles in cell growth, motility, survival and proliferation. It is well documented to be upregulated in Colon tumor tissues and has been associated with both Breast and Pancreatic cancers [42].
As epithelial cells undergo transformation they lose their basal membrane survival cues. RSK1 has been identified as a pivotal activated kinase inducing autocrine loops that permit cell motility and invasiveness of transformed epithelial cells [43]. It is also established that RSK1 phosphorylates TSC2 [44], inhibiting its tumor suppressor function by activating the mTOR signaling pathway and promoting translation. Our data shows that RSK1 is significantly altered in phosphorylation state between all stages. Phosphorylation of p90RSk is significantly increasing between stages I to II, I to III, I to IV, and II to III followed by a significant decrease from stage III to IV where stage IV is still significantly higher than stage I (Fig. 3).
As a downstream effector of the Ras/ERK/MAPK signaling cascade, p90RSK is a direct substrate of ERK1/2 [44]. As shown previously, ERK1/2 also significantly decreased in phosphorylation level from stage III to IV and this is reflected here with p90RSK phosphorylation level.
miRanda predicts 94 miRNA target p90RSK. We measured 46 and observed 21 altered, of which, with regards to stage IV, only 7 were significantly depressed and the remainder unaltered.
Discussion
The phosphorylation levels of IGF-1R, IRS1, Akt, GSK3αβ, p70 S6 kinase, MEK1, ERK1/2, JNK, p38 MAPK, and ATF2 all showed significant levels of dysregulation across stages of CRC. Negative feedback systems and miRNA expression changes are supported as regulatory elements of this dysregulation and shed light on the connection between miRNA and signaling events in IGF-1R signaling in CRC. The observation that IRS-1, GSK3α/β, p70S6 kinase, ERK1/2, MAPK14, and p90RSK all show significant increases in phosphorylation across stages I, II, and III followed by a decrease at stage IV implies that a shift of mechanisms is at play and warrants further investigation. We suggest that this shift is from protein synthesis and evasion of apoptosis to growth and differentiation. Furthermore we show that miRNAs targeting these signaling molecules are downregulated when an increase in phosphorylation is observed and normalized as decreased phosphorylation is observed. Together these observations make a strong implication of miRNAs as an underlying mechanism in dysregulation at the heart of CRC.
miRNAs currently being considered as valid biomarkers include both upregulated “oncomiRs” and down regulated tumor suppressor miRNAs. This list is continually growing but includes miR-18a, miR-21, miR-30a-3p, miR-30a-5p, miR-126, miR-135b, miR-143, miR-145, miR-155, miR-183, & the let-7 family [45, 46, 47, 48, 49]. With respect to Colorectal Cancer we would add to this list the following miRs altered at all stages of CRC and based upon their multiple targets in the IGF-1R signaling pathway; hsa-miR-138, hsa-miR-194, hsa-miR-320, and hsa-miR-382.
Of the 130 miRNAs observed to be altered in CRC we observed a total of 94 miRNAs targeting signaling molecules in the IGF-1R pathway. This number is more impressive when it is appreciated that 45 of these miRNAs target 3 or more signaling molecules in our analysis. This suggests that miRNAs might also lead to identification of other signaling molecules previously unidentified in pathology to be causative. As the predictive power of miRanda and other algorithms increases, molecules that have not previously been associated with a disease or molecules that have not been assigned a function at all might be predicted to have some therapeutic value. Taken together our research identifies a subset of miRNAs that can serve as biomarkers of CRC stage and significantly it points to the critical role of the IGF-1 pathway in CRC progression. These studies also provide rationale for anti-IGF-1 targeted therapy in CRC.
Conflict of Interest
The authors have declared that no conflict of interest exists.
References
1. Liu J, Rivas F.V, Wohlschlegel J, Yates J.R, Parker R, Hannon G.J. A role for the P-body component GW182 in microRNA function. NATURE CELL BIOLOGY. 2005;7(12):1261- 1266
2. Buck E, Eyzaguirre A, Rosenfeld-Franklin M, Thomson S, Mulvihill M, Barr S, Brown E, O'Connor M, Yau Y, Pachter J, Miglarese M, Epstein D, Iwata K, Haley J, Gibson N, Ji Q. Feedback Mechanisms Promote Cooperativity for Small Molecule Inhibitors of Epidermal and Insulin-like Growth Factor Receptors. Cancer Research. 2008;68(20):8322- 8332
3. Ostrowski J, Woszczynski M, Kowalczyk P, Wocial T, Hennig E, Trzeciak L, Janik P, Bomsztyk K. Increased activity of MAP, p70S6 and p90rs kinases is associated with AP-1 activation in spontaneous liver tumors, but not in adjacent tissue in mice. British Journal of Cancer. 2000;82(5):1041- 1050
4. Reidemann J, Macaulay V. IGF1R signaling and its inhibition. Endocrine-Related Cancer. 2006;13:S33-S43
5. Katoh M, Katoh M. Cross-talk of WNT and FGF Signaling Pathways at GSK3b to Regulate b-Catenin and SNAIL Signaling Cascades. Cancer Biology & Therapy. 2006;5(9):1059-1064
6. Johnson S, Gulhati P, Rampy B, Han Y, Rychahou P, Doan H, Weiss H, Evers B. Novel Expression Patterns of PI3K/Akt/mTOR Signaling Pathway Components in Colorectal Cancer. Journal of the American College of Surgeons. 2009;210(5):767- 776
7. Lee S, Lee J, Soung Y, Kim S, Nam S, Park W, Kim S, Yoo N, Lee J. Colorectal tumors frequently express phosphorylated Mitogen-activated protein kinase. Acta Pathologica, Microbiologica et Immunologica Scandinavica. 2004;112:233-238
8. Zumkeller W. Epidemiological Approaches to Evaluating Insulin-Like Growth Factor and Cancer Risk. In: (ed.) LeRoith D, Zumkeller W, Baxter R.C. Insulin-like Growth Factors. Texas: Landes Bioscience. 2003:329-333
9. Slattery M.L, Samowitz W, Curtin K, Ma K.N, Hoffman M, Caan B, Neuhausen S. Association among IRS1, IRS2, IGF1 and IGFBP3 genetic polymorphism and colon cancer. Cancer Epidemiol. Biomarkers Prev. 2004;13:1206-1214
10. Baserga R, Hongo A, Rubini M, Prisco M, Valentinis B. The IGF-I receptor in cell growth, transformation and apoptosis. Biochimica et Biophysica Acta. 1997;1332:F105-F126
11. Su A, Wiltshire T, Batalov S, Lapp H, Ching K, Block D, Zhang J, Soden R, Hayakawa M, Kreiman G, Cooke M, Walker J, Hogenesch J. A gene atlas of the mouse and human protein-encoding transcriptomes. PNAS. 2004;101(16):6062- 67
12. Betel D, Koppal A, Agius P, Sander C, Leslie C. Comprehensive modeling of microRNA targets predicts functional non-conserved and non-canonical sites. Genome Biology. 2010;11:R90
13. Betel D, Wilson M, Gabow A, Marks DS, Sander C. The microRNA.org resource: targets and expression. Nucleic Acids Res. 2008;36:D149-53
14. John B, Enright AJ, Aravin A, Tuschl T, Sander C, Marks DS. Human MicroRNA targets. PLoS Biol. 2005;3(7):e264
15. Enright AJ, John B, Gaul U, Tuschl T, Sander C, Marks DS. MicroRNA targets in Drosophila. Genome Biology. 2003;5:R1
16. Ryan PD, Goss PE. The emerging role of insulin-like growth factor pathway as a therapeutic target in cancer. Oncologist. 2008;13:16-24
17. Dearth R, Cui X, Kim H. Hadsell D, Lee A. Oncogenic Transformation by the Signaling Adaptor Proteins Insulin Receptor Substrate (IRS) -1 and IRS - 2. Cell Cycle. 2007;6(6):705-713
18. Miura M, Li S, Baserga R. Effect of a Mutation at Tyrosine 950 of the Insulin-like Growth Factor I Receptor on the Growth and Transformation of Cells. CANCER RESEARCH. 1995;55:663-667
19. Sehat B, Andersson S, Vasilcanu R, Girnita L, Larsson O. Role of Ubiquitination in IGF-1 Receptor Signaling and Degradation. PLOS. 2007;4:e340
20. Chang Q, Li Y. White M, Fletcher J, and Xiao S. Constitutive Activation of Insulin Receptor Substrate 1 Is a Frequent Event in Human Tumors: Therapeutic Implications. CANCER RESEARCH. 2002;62:6035-6038
21. Saxena N, Taliaferro-Smith L, Knight B, Merlin D. Biodirrectional Crosstalk between Leptin and Insulin- like Growth Factor - 1 Signaling Promotes Invasion and Migration of Breast Cancer Cells via Transactivation of Epidermal Growth Factor Receptor. Cancer Res. 2008;68(23):9712-22
22. Scamuffa N, Siegfried G, Bontemps Y, Ma L, Basak A, Cherel G, Calvo F, Seidah N, Khatib A. Selective inhibition of proprotein convertases represses the metastatic potential of human colorectal tumor cells. J. Clin. Invest. 2008;118:352-363
23. Tremblay F. et al. Identification of IRS-1 Ser-1101 as a target of S6K1 in nutrient- and obesity-induced insulin resistance. PNAS. 2007;104(35):14056-14061
24. Um S, Frigerio F, Watanabe M, Picard F, Joaquin M, Sticker M, Fumagalli S, Allegrini P, Kozma S, Auwerx J. and Thomas G. Absence of S6K1 protects against age- and diet- induced obesity while enhancing insulin sensitivity. NATURE. 2004;431(9):200-205
25. Harrington L, Findlay G, Gray A, Tolkacheva T, Wigfield S, Rebholz H, Barnett J, Leslie N, Cheng S, Shepherd P, Gout I, Downes C, Lamb R. The TSC1-2 tumor suppressor controls insulin-PI3K signaling via regulation of IRS proteins. J. Cell Biol. 2004;166:213-223
26. Manning B, Cantley L. Akt/PKB Signaling: Navigating Downstream. Cell. 2007;129(7):1261-1274
27. Buck E, Eyzaguirre A, Rosenfeld-Franklin M, Thomson S, Mulvihill M, Barr S, Brown E, O'Connor M, Yao Y, Pachter J, Miglarese M, Epstein D, Iwata K, Haley J, Gibson N, Ji Q. Feedback Mechanisms Promote Cooperativity for Small Molecule Inhibitors of Epidermal and Insulin-Like Growth Factor Receptors. Cancer Res. 2008;68(20):8322-32
28. Hennessy B, Smith D, Ram P, Lu L, Mills G. Exploiting the PI3K/AKT Pathway for Cancer Drug Discovery. Nature Reviews Drug Discovery. 2005;4:988-1004
29. Roy H, Olusola B, Clemens D, Karolski W, Ratashak A, Lynch H, Smyrk T. AKT proto-oncogene overexpression is an early event during sporadic colon carcinogenesis. Carcinogenesis. 2002;23(1):201-205
30. Huang X, Chen J. Obesity, the PI3K/Akt signal pathway and colon cancer. Obesity reviews. 2009;10:610-616
31. Gulhati P, Cai Q, Li J, Liu J, Rychahou P, Qiu S, Lee E, Silva S, Bowen K, Gao T, Evers B. Targeted Inhibition of Mammalian Target of Rapamycin Signaling Inhibits Tumorgenesis of Colorectal Cancer. Clinical Cancer Research. 2009;15:7207-7216
32. Haar E, Lee S, Bandhakavi S, Griffin T, Kim D. Insulin signalling to mTOR mediated by the Akt/PKB Substrate PRAS40. Nature Cell Biology. 2007;9:316- 323
33. Cross D, Alessi D, Cohen P, Andjelkovich M, Hemmings B. Inhibition of glycogen synthase kinase-3 by insulin mediated by protein kinase B. Nature. 1995;378:785-789
34. Jope R, Yuskaitis C, Beurel E. Glycogen Synthase Kinase-3 (GSK3): Inflamation, Diseases, and Therapeutics. Neurochem Res. 2007;32(4-5):577-595
35. Kang T, Wei Y. Chiang Y, Yamaguch H, Appella E, Hung M, and Piwnica-Worms H. GSK-3β Targets Cdc25A for Ubiquitin-Mediated Proteolysis and GSK-3β Inactivation Correlates with Cdc25A Overproduction in Human Cancers. Cancer Cell. 2008;13(1):36-47
36. Nozawa H, Watanabe H, Nagawa H. Phosphorylation of ribosomal p70 S6 kinase and rapamycin sensitivity in human colorectal cancer. Cancer Letters. 2007;251:105-113
37. Julien L, Carriere A, Moreau J, Roux PP. mTORC1-Activated S6K1 Phosphorylates Rictor on Threonine 1135 and Regulates mTORC2 Signaling. Molecular and Cellular biology. 2010;30(4):908-921
38. Ballif B, Roux P, Gerber S, MacKeigan J, Blenis J, Gygi S. Quantitative phosphorylation profiling of the ERK/p90 ribosomal S6 kinase-signaling cassette and its targets, the tuberous sclerosis tumor suppressors. PNAS. 2005;102(3):667-672
39. Remacle-Bonnet MM, Garrouste FL, Hellar S. et al. Insulin-like growth factor - I protects colon cancer cells from death factor- induced apoptosis by potentiating tumor necrosis factor alpha - induced mitogen - activated protein kinase and nuclear factor kappaB signaling pathways. Cancer Research. 2000;60:2007- 17
40. Lee S, Bahn J, Whitlock N, Baek S. Activating transcription factor 2 (ATF2) controls tolfenamic acidinduced ATF3 expression via MAP kinase pathways. Oncogene. 2010;29(37):5182-5192
41. Ouwens D, Ruiter N, van der Zon G, Carter A, Schouten J, van der Burgt C, Kooistra K, Bos J, Maassen J, van Dam H. Growth factors can activate ATF2 via a two-step mechanism: Phosphorylation of Thr71 through the RAS-MEK-ERK pathway and of Thr69 through RalGDS-Src-p38. EMBO. 2002;21(14):3782-3793
42. Carriere A, Ray H, Blenis J, Roux PP. The RSK factors of activating the Ras/MAPK signaling cascade. Front Biosci. 2008;1(13):4258-75
43. Doehn U, Hauge C, Frank SR, Jensen CJ, Duda K, Nielsen JV, Cohen MS, Johansen JV, Winther BR, Lund LR, Winther O, Taunton J, Hansen SH, Frödin M. RSK is a principal effector of the RAS-ERK pathway for eliciting a coordinate promotile/invasive gene program and phenotype in epithelial cells. Mol Cell. 2009;35(4):511-22
44. Anjum R, Blenis J. The RSK family of kinases: emerging roles in cellular signaling. Nat Rev Mol. Cell Biol. 2008;9:747-758
45. Beezhold1 KJ, Castranova1 V, Chen F. Microprocessor of microRNAs: regulation and potential for therapeutic intervention. Molecular Cancer. 2010;9:134
46. Pasquinelli AE, Ruvkun G. Control of Developmental timing by microRNAs and their targets. Annu Rev Cell Dev Biol. 2002;18:495-513
47. Xiao Rajewsky K. MicroRNA Control in the Immune System: Basic Principles. Cell. 2009;136(1):26-36
48. Kim J, Inoue K, Ishii J, Vanti WB, Voronov SV, Murchison E, Hannon G, Abeliovich A. A microTNA feedback circuit in midbrain dopamine neurons. Science. 2007;317(5842):1179-80
49. Visone R, Croce CM. MiRNAs and cancer. Am J Pathol. 2009;174(4):1131-8
50. Kanehisa M, Goto S, Furumichi M, Tanabe M, Hirakawa M. KEGG for representation and analysis of molecular networks involving diseases and drugs. Nucleic Acids Res. 2010;38:D355-D360
51. Kanehisa M, Goto S, Hattori M, Aoki-Kinoshita K.F, Itoh M, Kawashima S, Katayama T, Araki M, Hirakawa M. From genomics to chemical genomics: new developments in KEGG. Nucleic Acids Res. 2006;34:D354-357
Author contact
![]() Corresponding author: davidlknowltoncom
Corresponding author: davidlknowltoncom