Journal of Cancer
ISSN: 1837-9664
3.2
Impact Factor
ISSN: 1837-9664

 Global reach, higher impact
J Cancer 2010; 1:38-50. doi:10.7150/jca.1.38 This volume Cite
Research Paper
Undetectable and Decreased Expression of KIAA1949 (Phostensin) Encoded on Chromosome 6p21.33 in Human Breast Cancers Revealed by Transcriptome Analysis
Yan A. Su1 ![]() , Jun Yang1, Lian Tao1, Hein Nguyen1, Ping He2
, Jun Yang1, Lian Tao1, Hein Nguyen1, Ping He2
1. GenProMarkers Inc., Rockville, Maryland 20850, USA;
2. Division of Hematology, Center for Biological Evaluation and Research, Food and Drug Administration, Bethesda, MD 20892, USA
Published 2010-6-21
Citation:
Su YA, Yang J, Tao L, Nguyen H, He P. Undetectable and Decreased Expression of KIAA1949 (Phostensin) Encoded on Chromosome 6p21.33 in Human Breast Cancers Revealed by Transcriptome Analysis. J Cancer 2010; 1:38-50. doi:10.7150/jca.1.38. https://www.jcancer.org/v01p0038.htm
Other stylesAbstract
Cytogenetic aberration and loss of heterozygosity (LOH) are documented on chromosome 6 in many cancers and the introduction of a neo-tagged chromosome 6 into breast cancer cell lines mediates suppression of tumorigenicity. In this study, we described the identification of KIAA1949 (phostensin) as a putative tumor suppressor gene. Our microarray analysis screened 25,985 cDNAs between a tumorigenic and metastatic breast cancer cell line MDA-MB-231 and the chromosome 6-mediated suppressed, non-tumorigenic and non-metastatic derivative cell line MDA/H6, resulting in the identification of 651 differentially expressed genes. Using customized microarrays containing these 651 cDNAs and 117 controls, we identified 200 frequently dysregulated genes in 10 breast cancer cell lines and 5 tumor tissues using MDA/H6 as reference. Our bioinformatics analysis revealed that chromosome 6 encodes 25 of these 200 genes, with 4 downregulation and 21 upergulation. Northern analysis validated microarray results and was used to detect the size and number of RNA species of 2 downregulated (KIAA1949, PTK7) and 2 upregulated (SFRS3, HMGN3) genes in the cell lines. Particularly, the KIAA1949 gene at 6p21.33, a band region with the frequent cytogenetic aberration and LOH encodes 4 poly(A)-RNA species (4.6-, 4-, 3- and 1.5-kb) in multiple normal and breast cancer samples. Microarray analysis revealed KIAA1949 downregulation in 86.7% (n=15) of breast cancer cell lines and tumor tissues. Northern analysis demonstrated undetectable and decreased expression of KIAA1949 in 100% (n=10) of breast cancer cell lines. Taken together, these results strongly suggest KIAA1949 is a novel candidate breast cancer suppressor gene.
Keywords: Breast cancer, MDA-MB-231, Microarray, Tumor suppressor gene, Phostensin, KIAA1949
Introduction
Cytogenetic and loss of heterozygocity (LOH) studies document frequent genetic alterations on chromosome 6 in many types of human cancers including breast cancer and malignant melanoma. In human breast cancer, 18-57% deletion frequencies in primary breast tumor tissue (n=72) were reported on the short arm of chromosome 6 (6p) using 13 microsatellite markers at 6p21 (1). On the long arm of chromosome 6 (6q), five distinct regions of allelic imbalance or LOH were observed in breast cancer tumor tissues (2-5) and cell lines (6;7). Functionally, the microcell-mediated introduction of a neo-tagged chromosome 6 resulted in the suppression of transformed, tumorigenic, and/or metastatic characteristics of breast cancer cell lines MCF7(8), MDA-MB-231 (8), and CAL51 (9), and of the malignant melanoma cell line UACC903 (10). The structural and functional evidence strongly suggest the presence of chromosome 6-encoded tumor suppressor genes that have yet to be identified.
Our study of malignant melanoma using human chromosome 6-mediated suppressed melanoma cell line UACC903(+6) (10) led to the identification of chromosome 6-encoded connexin 43 (Cx43, or gap junction protein, alpha 1, 43kDa [GJA1], 6q21-q23.2) as a melanoma suppressor gene (11), the transfection and overexpression of Cx43 cDNA in breast cancer cell line MDA-MB-231 by other investigators suppressed the xenograft tumor growth in athymic nude mice (12). Cx43 may be only one of several candidate breast cancer suppressor genes encoded by chromosome 6. Others include pleiomorphic adenoma gene-like 1 (PLAGL1 or Zac1/Lot1, 6q24-q25) (13), Parkinson disease (autosomal recessive, juvenile) 2 (PARK2, 6q25.2-q27) (14), and SAM and SH3 domain containing 1 (SASH1, 6q24.3) (15). Because human breast cancers are extremely heterogeneous in biological behavior and clinical outcomes, the phenotypic complexity may be due to the broad differences in gene expression that are determined by genetic and epigenetic alterations accumulated during the cancer development and by the gene-environment interactions. In addition, none of above candidate tumor suppressor genes can fully explain chromosome 6-mediated suppression of tumorigenicity in breast cancer cell lines MCF7 (8), MDA-MB-231 (8) and CAL51 (9). It is conceivable that direct comparison of gene expression profile between a breast cancer cell line and its chromosome 6-mediated suppressed derivative cell line may lead to the identification of a putative breast cancer suppressor gene.
The DNA microarray technology (16) has facilitated the identification of expression profiles and association of abnormal patterns to hereditary breast cancer (17), sporadic breast cancer (18;19), and clinical outcomes (20;21). Combined with PCR subtraction, DNA microarrays were also used for rapid isolation of differentially expressed genes in breast cancers (22;23). Using cDNA microarrays, we had successfully identified the chromosome 6-encoded tumor suppressor gene Cx43 (11). In this study, we describe the identification of another chromosome 6-encoded novel candidate tumor suppressor gene KIAA1949 (phostensin) using both genome-wide microarrays of 25,985 cDNA probes and customized microarrays of 651 genes and 117 controls. The genome-wide microarrays were used to screen differentially expressed genes between the tumorigenic and metastatic breast cancer cell line MDA-MB-231 and the chromosome 6-mediated suppressed non-tumorigenic and non-metastatic derivative cell line MDA/H6. The customized cDNA microarray contained double sets of 651 genes and 117 controls per glass slide and was used to analyze expression profiles in 10 breast cancer cell lines and 5 primary breast tumor specimens with MDA/H6 as a reference. Microarray analysis identified 200 frequently dysregulated genes in these breast cancer samples. Out of the 25 genes that are known to be encoded by chromosome 6, four were downregulated but 21 were upergulated. Northern analysis validated the microarray results. The KIAA1949 gene is known at 6p21.33, a band region with the frequent cytogenetic aberration and LOH. Our Northern analysis on KIAA1949 detected four poly(A)-RNA bands (4.6-, 4-, 3- and 1.5-kb) in multiple normal and breast cancer samples. Microarray analysis revealed the downregulation of KIAA1949 in 86.7% (n=15) of breast cancer cell lines and tumor tissues. Northern analysis demonstrated 100% (n=10) downregulation in the cell lines. Taken together, these results strongly suggest that KIAA1949 is a novel candidate breast cancer suppressor gene.
Materials and Methods
Cell lines, tumor tissues, and cell culture conditions: Table 1 list 11 breast cancer cell lines and 5 tumor tissues used in this study. Ten breast cancer cell lines were purchased from American Type Culture Collection (www.atcc.org). The MDA/H6 cell line (8) was generously provided by Dr. Negrini. Cells were cultured in DMEM medium with L-glutamine supplemented with 10% fetal bovine serum. G418 (800 μg/ml) was added to MDA/H6 cell culture to select for the neo-tagged chromosome 6. 100 U penicillin G sodium and 100 µg streptomycin sulfate were added into each milliliter of all cell culture media as antibiotics. Breast cancer tissue samples with pathological reports were purchased from the Lombardi Cancer Center Histopathology/Tissue Core, Georgetown University Medical Center. The patients' identifications of all tissue samples had been removed by the core facility personnel before the PI received the samples. All media, serum, and antibiotics were obtained from GIBCO BRL (Gaithersburg, MD).
Table 1
Human Breast Cancer Cell Lines and Tumor Tissues
| Name | Symbol | Original Clinical Diagnosis | Source |
|---|---|---|---|
| MDA-MB-231 | MB231 | Adenocarcinoma | ATCC* |
| MDA/H6 | MDA/H6 | Non-tumorigenic | Dr. Negrini (8) |
| MDA-MB-134 | MB134 | Carcinoma | ATCC |
| MDA-MB-157 | MB157 | Carcinoma | ATCC |
| MDA-MB-436 | MB436 | Adenocarcinoma | ATCC |
| MDA-MB-453 | MB453 | Carcinoma | ATCC |
| MDA-MB-468 | MB468 | Adenocarcinoma | ATCC |
| BT-20 | BT20 | Adenocarcinoma | ATCC |
| BT-474 | BT474 | Ductal carcinoma | ATCC |
| BT-549 | BT549 | Ductal carcinoma | ATCC |
| ZR75-1 | ZR751 | Ductal carcinoma | ATCC |
| Breast cancer tissue 1 | BCTis-1 | Poorly differentiated invasive ductal carcinoma | LCC* |
| Breast cancer tissue 2 | BCTis-2 | Poorly differentiated infiltrating ductal carcinoma | LCC |
| Breast cancer tissue 3 | BCTis-3 | Poorly differentiated infiltrating carcinoma | LCC |
| Breast cancer tissue 4 | BCTis-4 | Poorly differentiated infiltrating ductal carcinoma | LCC |
| Breast cancer tissue 5 | BCTis-5 | Poorly differentiated infiltrating ductal carcinoma | LCC |
* ATCC: American Type Culture Collection; LCC: Lombardi Cancer Center Histology Facility.
Tumorigenicity test. The test was performed by the standard methods in the IACUC approved animal protocol and core facility. Briefly, 0.1 ml of 5 x 10⁷ cells per ml were inoculated in subcutaneous fat pad at one site of flank of female athymic nude mice at age of 4 weeks. Three mice per cell line were tested. The mice were subject to euthanasia when a tumor reaches 20 mm in diameters. Otherwise, the mice were under the standard housing, feeding and observation for 2 months. After euthanasia, tumors and inoculation sites were dissected from the mice for the gross examination of tumor size and morphology. The distant organs (brain, lung, liver, kidney, spleen and bone marrow) were collected to culture metastatic human breast cancer cells.
RNA and DNA preparation: Total RNA was extracted from cultured cells using Trizol Reagent (Invitrogen, Carlsbad, CA, USA) and purified using RNeasy kit (Qiagen, Valencia, CA, USA), following the commercial instructions. Poly(A)-RNA was extracted from total RNA samples by use of Dynabeads® mRNA Purification Kit (Cat.# 610-06, Invitrogen), following the manufacture instructions. Culture of E. coli strain DH5α, isolation of plasmid DNA and PCR amplification of cDNA inserts were described previously (24).
Microarray hybridization on high density gene filters of cDNA microarrays: High density gene filters (gf200, gf201, gf202, gf203 and gf211) were purchased from Research Genetics (Huntsville, AL). New gene filters were first washed in boiling 0.5% SDS for 5 min., placed in a 35 x 150 mm roller tube (052-002, Biometra, Tampa) with the DNA side facing the center of the tube, and then incubated in 5-mL pre-hybridization solution (HYB125.GF, Research Genetics) with 5-µl Poly(dA) (POLYA.GF, Research Genetics) and 5-µl Cot-1 DNA (15279-011, Life Technologies) at 42ºC for 2 to 4 hours.
The first strand cDNA was labeled as follows. Total RNA (0.8μg) was suspended to 8-μl Rnase-free water. Two μl of 1μg/μl 10-20 mer of Oligo-(dT) (POLYT.GF, Research Genetics) was added to the RNA solution in a tube that was then incubated in a 65ºC for 10 min. Then, 6-μl 5X First Strand Buffer (18064-014, Life Technologies), 1-μl of 0.1 M DTT (18064-014, Life Technologies), 1.5-μl of 100 mM dNTP (27-2035-02, Amersham Pharmacia), 1.5-μl Superscript II reverse transcriptase (18064-014, Life Technologies) and 10-μl [α-33P]dCTP (BF1003, Amersham Pharmacia) were added and mixed thoroughly. The mixture was placed in a water bath at 37ºC for 90 minutes.
The labeled cDNA was brought up to 100-μl Rnase-free water and then purified by use of a Bio-Spin 6 chromatography column (732-6002, Bio-Rad, Hercules, CA) following the manufacturer's instruction. DNA with more than 5% of α-33P incorporation, measured by use of Scanner QC4000 (Bioscan Inc. Washington, D.C.), was denatured for 5 min in a boiling water bath and added directly to the pre-hybridization. The hybridization was allowed to continue for 15 h at 42ºC. The washes were done to the final stringency of 0.5x SSC, 1% SDS at 50oC for 15 min. The filters were placed on ddH2O-moistened piece of Whatmann paper (28458-005, VWR, Bridgeport, NJ), exposed onto a phosphor screen (Molecular Dynamics) for 5 h, and scanned for signals with the Storm 840 Scanner (Molecular Dynamics). The tiff images were transferred to software IPLab/ArraySuite v2.0 (NHGRI/NIH) for identification of differentially expressed genes as described previously(11).
Customized microarrays on glass slides: Methods for making DNA microarrays on glass slides were described previously (24). Briefly, human cDNA inserts were amplified by PCR using the vector sequence-specific primers flanking the inserts on plasmid DNA. The purified DNA (0.2 μg/ml) of 651 cDNAs, 80 housekeeping genes for ratio control (25), 4 non-specific DNA controls and 33 negative controls were printed in double sets on poly(Lysine)-coated glass slides.
The first strand cDNA was labeled by using MicroMax Kit 501 (NEN, Boston, MA) following the manufacturer's instruction. All cancer samples were labeled with the fluorescent Cy3-dUTP and the reference sample (MDA/H6) with Cy5-dUTP. Briefly, 50-μg total RNA was mixed with Cy3-dUTP (or Cy5-dUTP) and other reagents from the kit to synthesize the label first strand cDNA at 42ºC for 1 h. The reaction was stopped by addition of 2.5-μl 0.5M EDTA and 2.5-μl 1N NaOH and then incubated at 65ºC for 30 min. After adding 6.2-μl 1M Tris-HCl (pH 7.5), the samples were purified by use of Microcon 100 (Cat. No. 42412, Millipore Corp., Bedford, MA) to remove unincorporated nucleotides and salts. The Cy3- and Cy5- labeled DNA samples of each pair were dissolved into 25-μl Hybridization Buffer from the kit by heating at 50ºC for 10 min prior to placing onto a microarray slide. Hybridization was allowed to proceed at 65ºC for 16 h. The slides were washed to a final stringency of 0.06 x SSC at room temperature for 15 min. Slides were scanned by use of GenePix 4000A Laser Scanner (Axon Instruments, Inc., Foster City, CA). For each slide, two fluorescent intensities (Cy3, Cy5) were scanned separately and then placed into the red and green channel as the tiff images in software IPLab/ArraySuite v2.0 (NHGRI, NIH) for analysis as described previously (25).
Database and bioinformatics data analysis: Gene expression database, data filtering and selection were constructed and performed as described previously (26). The quantile normalization method (27) in software R version 2.7.1 (The R Foundation for Statistical Computing) was used to normalize microarray data. Hierarchical dendrogram clustering analysis of genes and samples were carried out by using software Cluster version 3.0 (28) and heatmap was visualized by using software MapleTree (http://rana.lbl.gov/EisenSoftware.htm). Gene ID, symbols and names were updated to human UniGene Build 221 (ftp://ftp.ncbi.nih.gov/repository/UniGene) based on human cDNA IMAGE clone ID (http://image.llnl.gov). Ontology, pathways and phenotypes of genes were compiled from Entrez (ftp://ftp.ncbi.nlm.nih.gov/gene) and DAVID Bioinformatics Resources 2008 (http://david.abcc.ncifcrf.gov). The mapped details of all chromosome 6-encoded genes were based on Homo sapiens Map Viewer Build 37.1 (www.ncbi.nlm.nih.gov/mapview).
Northern analysis: Northern hybridization was performed by standard methods (29). Total RNA or poly(A)-RNA, 20 μg per lane, was fractionated in 1.2% agarose-formaldehyde gels by electrophoresis. RNA was transferred onto Hybond-N+ membranes (Amershan Life Science) by capillary blotting overnight. The cDNA sequences of IMAGE Consortium EST clones: 208699 (KIAA1949), 813742 (PTK7), 173554 (SFRS3), 781404 (HMGN3), and 759200 (DHPS) were determined by DNA sequence analysis. Particularly, the cDNA fragments of 208699 correspond to the KIAA1949 full length mRNA sequence from 3827 to 4598 (www.ncbi.nlm.nih.gov/nuccore). The cDNA fragments of probe DNA were amplified by polymerase chain reaction (PCR) using vector-specific primers as described previously (24). The probes were labeled with [α-32P]dCTP using a Random Primed DNA Labeling Kit (Roche Applied Science, Indianapolis, IN). Northern hybridization was performed at 65oC for 16 hours in 5 ml hybridization solution including the final concentrations of 5 x SSC, 5 x Denhardt's solution, 1.5% (w/v) SDS, 0.5 μg/ml of denatured salmen sperm DNA and 25 ng of [α-32P]dCTP-labeled probe. The membrane were washed in 0.1 x SSC at 42oC for 20 min. Blots were exposed to Kodak X-Omat AR film at -80oC for 16 hours to 3 days.
Results
Strategy, validation of tumorigenicity, and screening differentially expressed genes. Figure 1 diagrammatically illustrates our strategy for the identification of a breast cancer tumor suppressor gene encoded by chromosome 6. First, we performed a tumorigenicity test to confirm phenotypic features of the breast cancer cell lines MDA-MB-231 and MDA/H6. MDA-MB-231 is a tumorigenic and metastatic breast cancer cell line. The introduction of a neo-tagged human chromosome 6 into MDA-MB-231 by Negrini et. al. generated the non-tumorigenic derivative cell line MDA/H6 (8). The results of our tumorigenicity test showed that the MDA-MB-231 cell line formed xenograft tumors rapidly (visible in three days and reaching more than 1 cm in diameter in two weeks) after inoculation in subcutaneous fat pad of the mice. Moreover, the culture of the mouse organs (brain, lung, liver, spleen, kidney and bone marrow) distant from the primary xenograft tumor sites revealed growth of metastatic MDA-MB-231 cells. In contrast, the MDA/H6 cell line did not give either visible tumor or metastatic cancer cells after the parallel inoculation for two months (Fig. 1). Secondly, we screened 25,985 cDNA probes for differentially expressed genes by microarray analysis of gene expression profile between these two cell lines. Using the threshold of more than 800 signal intensities and more than 2-fold expression differences, we identified 651 (2.5%) genes as the differentially expressed genes. Thirdly, we designed and fabricated customized microarrays with 651 genes and 117 various controls on glass slides to identify frequently dysregulated genes in multiple breast cancer cell lines and tumor tissues in comparison to MDA/H6. Fourthly, by correlating frequently downregulated genes to the chromosome band regions with known cytogenetic aberration and LOH, we identified a novel candidate tumor suppressor gene for further analysis.
High quality customized microarrays. Using the resultant 651 differentially expressed genes and 117 control probes, we designed and printed cDNA microarrays with these 768 DNAs in duplicate on each poly(lysine)-coated glass slide. The same batch of microarrays was used to measure gene expression in all breast cancer cell lines and tumor tissues studied. Figure 2A and 2B show the representative microarray images derived from hybridization with Cy3- and Cy5-labeled cDNA of the MDA-MD-231 and MDA/H6 cells. The calibrated expression ratios of informative genes (>800 average intensities in either red or green channel) from these two cell lines were subjected to log-transformation to obtain approximate normal distribution. The log-transformed ratios from one set of genes were drawn against those from the other as a scatter plot, from which a linear regression and Pearson coefficient of correlation were computed. Figure 2C and 2D show the strong positive linear relations (y=0.9944x + 0.0305 and y=0.9909x + 0.0079) between Set A and Set B on Slide 1 and Slide 2, respectively. In addition, Pearson coefficient of correlation between Set A and Set B on Slide 1 and Slide 2 were 0.9857 and 0.9744, respectively. The expression ratios of genes from Set A and Set B were averaged for the same slides. The resultant values from Slide 1 were plotted against those from Slide 2. The results indicated, as expected, a strong positive linear relation (y=1.0033x + 0.0058) with a high Pearson coefficient of correlation (r = 0.9823) (Fig. 2E). These results demonstrated the strength of reproducibility of the customized gene chips and microarray experiments.
Fig 1
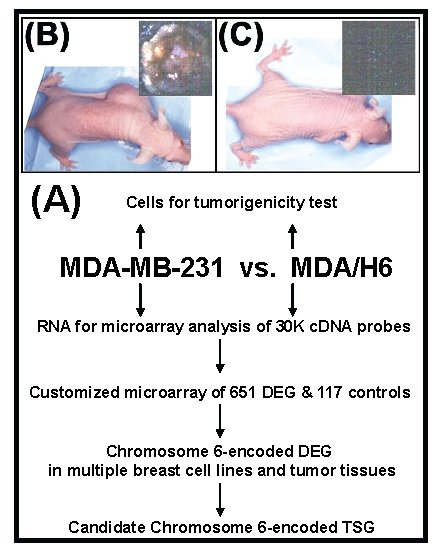
Experimental strategy and tumorigenicity. (A) A flow diagram illustrates the experimental strategy. (B) Human breast cancer cell line MDA-MB-231 formed tumor in athymic nude mice after s.c. inoculation of 5 x 10⁶ cells in athymic nude mice for 2 weeks. (C) MDA/H6 is a MDA-MB-231 derivative cell line that contains a neo-tagged human chromosome 6 and did not form any tumor after the inoculation for 2 months. DEG: differentially expressed gene; TSG: tumor suppressor gene.
Fig 2
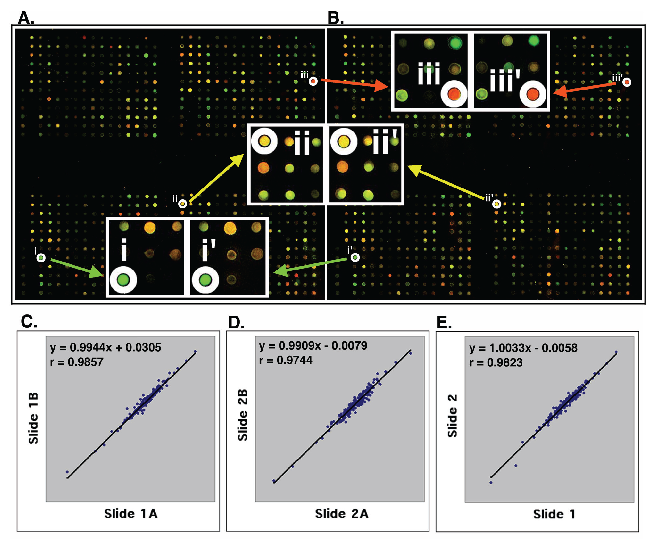
High quality customized cDNA microarray. (A, B) The images of two sets of 768 genes on the same glass slide. The image A shows the identical patterns with the image B. The enlarged image parts at i, ii, and iii in the set (A) are identical to those at i', ii' and iii' in the set (B). (C, D) Statistical analysis of the expression ratios of 200 informative genes between MDA-MB-231 and MDA/H6 were detected by two sets of genes (images A and B) on Slide 1 (C) and on Slide 2 (D). (E) The average ratios of the gene expression from Slide 1A and 1B were plotted against the average ratios from Slide 2A and 2B. The linear regression and Pearson coefficient of correlation were computed from the scatter plots that are on log-scale. The strong linear relations and high values of Pearson coefficient of correlation (r) are indicated in each comparison. "x": an gene expression ratio between MDA-MB-231 and MDA/H6 on x-axis; "y": the ratio between these two samples on the y-axis corresponding to a given "x".
Gene expression profiles of breast cancer cell lines and tumor tissues. The customized cDNA microarrays of the same batch were used to measure expression of 768 probes in duplicate in 11 breast cancers cell lines (MDA-MB-231, MDA/H6, MDA-MB-134, MDA-MB-157, MDA-MB-436, MDA-MB-453, MDA-MB-468, BT-20, BT-474, BT-549 and ZR75-1), and 5 breast cancer tumor tissue samples 1-5 (Table 1). To ensure consistent measures between Cy3- and Cy5-dUTP labeling, the fluorescence dye sways were performed on the MDA-MB-231 and MDA/H6 RNA samples, each in triplicate, and thus, a total of 6 microarray comparisons were performed. Then, RNA samples of MDA/H6 were labeled with Cy5-dUTP as the reference while other samples were labeled with Cy3-dUTP as the tests for microarray comparisons. Taken together, a total of 20 microarray experiments were performed and resultant 40 microarray images were processed for database construction and microarray data analysis. Out of 768 unique elements arrayed, 200 (26.04%) passed a uniform criteria that the average intensities of a spot in red or green channel was greater than 2,000 in the range from 0 to 65,535 and significantly differentially expressed in the breast cancers studied. The ratios of these 200 genes between a test sample and the reference RNA were used for unsupervised hierarchical clustering analysis. The results showed that all six comparisons of MDA-MB-231 with MDA/H6 were grouped in the same cluster as expected, with five breast cancer tumor samples in another group, and 9 breast cancer cell lines between the other two groups. The heatmap revealed 4 groups of genes, Group A with downregulation in all samples, Group B with downregulation in MDA-MB-231 and upregulation in others, Group C with upregulation in all samples, and Group D with upregulation in MDA-MB-231 and downregulation in others. (Fig. 3)
Chromosome 6-encoded differentially-expressed genes. Our bioinformatics analysis positioned all 200 differentially expressed genes onto their known chromosome band regions based on Homo sapiens Map Viewer Build 37.1. Figure 4 and Table 2 show the chromosome 6-encoded 25 genes and their expression levels in 10 breast cancer cell lines and 5 tumor tissues relative to those in MDA/H6. The chromosome 6 band regions with known cytegenetic aberration and LOH were also indicated in Figure 4. Thirteen genes were mapped to the short arm of chromosome 6 and 12 on the long arm, including in the order from the short arm to the long arm: NAD(P)H dehydrogenase quinone 2 (NQO2, 6p25.2), human immunodeficiency virus type I enhancer-binding protein 1 (HIVEP1, 6p24.1), adenylyl cyclase-associated protein 2 (CAP2, 6p22.3), SOX4 (6p22.3), zinc finger protein 184 (ZNF184, 6p22.1), transcribed locus-b (6p21.33), KIAA1949 (6p21.33), tubulin beta (TUBB, 6p21.33), ribosomal protein L10a (RPL10A, 6p21.31), splicing factor arginine/serine-rich 3 (SFRS3, 6p21.31), testis development related protein 1 (TDRG1, 6p21.2), protein tyrosine kinase 7 (PTK7, 6p21.1), transcribed locus-a (6p21.1), collagen type XII alpha 1 (COL12A1, 6q13), high mobility group nucleosomal binding domain 3 (HMGN3, 6q14.1), transcribed locus-c (6q14.1), CD164 antigen sialomucin (CD164, 6q21), phospholamban (PLN, 6q22.1), serum/glucocorticoid regulated kinase (SGK1, 6q23), splicing factor 3b subunit 5 10kDa (SF3B5, 6q24.2), chromosome 6 open reading frame 211 (C6orf211, 6q25.1), T-cell lymphoma invasion and metastasis 2 (TIAM2, 6q25.2), acetyl-Coenzyme A acetyltransferase 2 (ACAT2, 6q25.3), ribosomal protein S6 kinase 90kDa polypeptide 2 (RPS6KA2, 6q27), and programmed cell death 2 (PDCD2, 6q27). Out of these 25 genes, NQO2 and KIAA1949 were downregulated in 15 and 13 breast cancer samples, respectively. Both TUBB and SF3B5 were downregulated in 8 tumor samples and upregulated in one. PTK7 was downregulated in 6 samples and upregulated in 7. The other genes were essentially upregulated at a high frequency in these 15 breast cancer cell lines and tumor tissues. Both KIAA1949 and TUBB are encoded in 6p21.33, a band region with the known high frequency in LOH. (Fig. 4 and Table 2)
Table 2
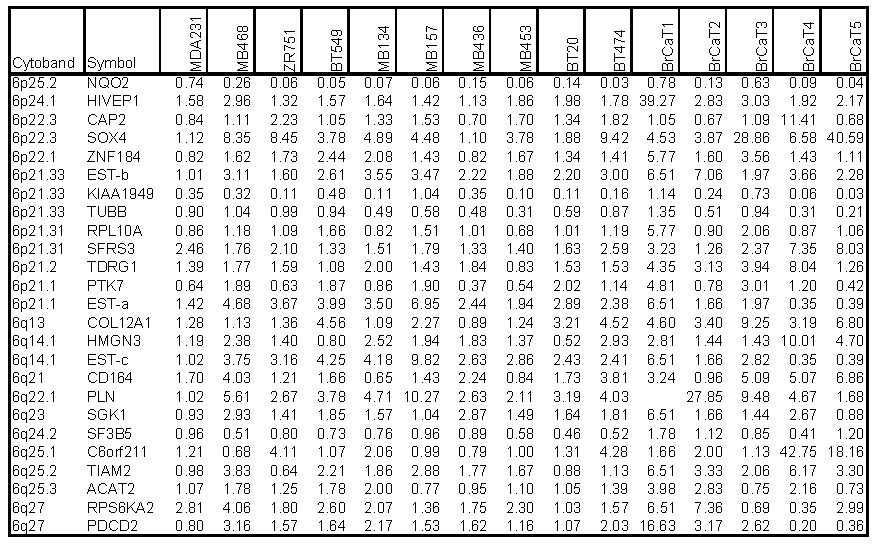
Expression Ratios of 25 Chromosome 6-Encoded Genes in Breast Cancer Cell Lines (n=10) and Tumor Tissues (n=5) to the MDA/H6 Cell Line.
Fig 3
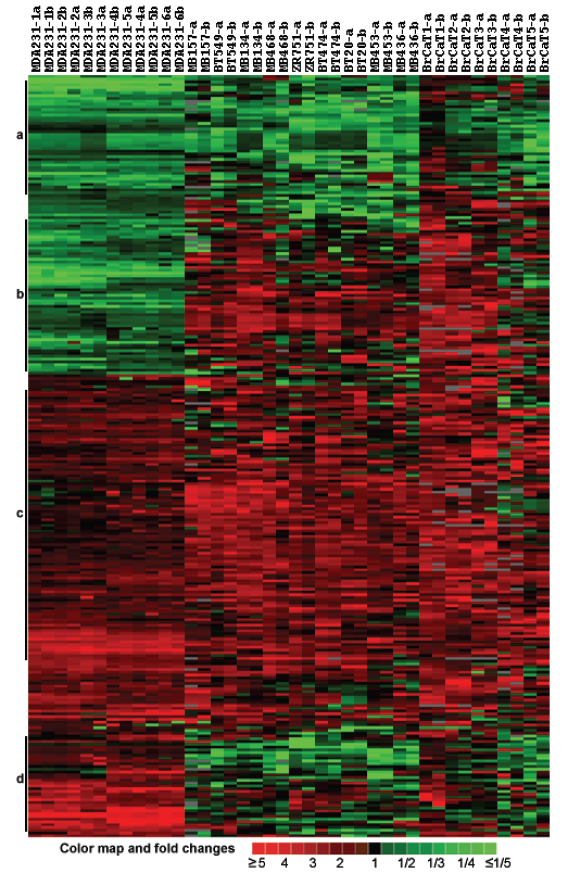
Cluster and heat map of 200 differentially expressed genes in 10 breast cancer cell lines and 5 cases of breast cancer tumor tissues compared with the MDA/H6 cell line based on 20 microarray experiments and 40 microarray images. (a) A cluster of genes downregulated in most samples, (b) downregulated in MDA-MB-231 but upregulated in most other samples, (c) upregulated in almost all samples, and (d) upregulated in MDA-MB-231 but downregulated in most other samples. The color bar indicates color map and fold changes in expression ratios.
Fig 4
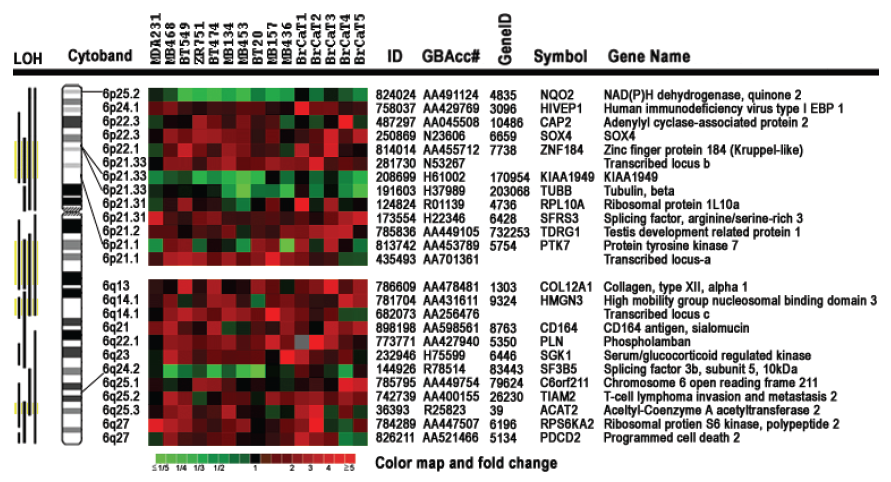
Expression patterns of 25 chromosome 6-encoded genes in 10 breast cancer cell lines and 5 cases of breast cancer tumor tissues compared with the chromosome 6-mediated suppressed non-tumorigenic and non-metastatic breast cancer cell line MDA/H6. The gene expression ratio between MDA-MB-231 and MDA/H6 were derived from 12 microarray images with Cy3 and Cy5 dye sways in cDNA labeling, while the ratio between others and MDA/H6 were from the duplicate microarrays. Cytobands indicate chromosome 6 band regions of the resultant genes. The color map indicates fold changes in expression ratios. LOH: loss of heterozygosity was based on the compiled data from the PUBMED literature. Yellow color indicates the highest frequency in LOH documented in literature; EBP: enhancer-binding protein.
Validation of RNA expression and detection of RNA sizes by Northern blots. To validate microarray results, we conducted Northern analyses of RNA levels for KIAA1949, PTK7, SFRS3, HMGN3 in 11 breast cancer cell lines, using deoxyhypusine synthase (DHPS, 19p13.13) as control for RNA loading and transfer because of its relative consistent RNA levels in these 11 breast cancer cell lines revealed by the microarrays. Twenty micrograms of total RNA per lane from each cell line were used for Northern blots. The results demonstrated the presence of two transcripts (4 kb and 3 kb) of KIAA1949 in 8 of 11 cell lines. In comparison to MDA/H6, the KIAA1949 RNA levels were absent in ZR75-1 and BT-474, had 2-20 fold downregulation in MDA-MB-231, MDA-MB-463, MDA-MB-453, MDA-MB-468, BT-20, MDA-MB-157 and MDA-MB-134, but displayed no change in BT-549. Four of other genes (PTK7, SFRS3, HMGN3 and DHPS) each had only one transcript. The RNA levels of PTK7 were downregulated in MDA-MB-231, ZR75-1 and MDA-MB-436, no change in MDA-MB-134, but upregualted in BT-474, BT-549, MDA-MB-453, MDA-MB-468, BT-20 and MDA-MB-157. The SFRS3 RNA was upregulated in all 11 breast cancer cell lines. The HMGN3 RNA had no change in MDA-MB-231 and BT-20, but showed upregulation in others. (Fig. 5)
Detection of 4 poly(A)-RNA variants of KIAA1949 and their downregulation in breast cancer cell lines. Our Northern analysis using total RNA detected 2 RNA species of KIAA1949 in multiple breast cancer cell lines. To see the RNA sizes and changes in expression, we performed Northern analysis using 20 μg of poly(A)-RNA per lane from each of 11 breast cancer cell lines. The results demonstrated the presence of 4 mRNA species of KIAA1949 gene, including 4.6-, 4-, 3- and 1.5-kb. In comparison to MDA/H6, these mRNA species were either undetectable or downregulated in all 10 breast cancer cell lines tested. Specifically, these RNA bands were absent in ZR75-1, BT474 and BT20, barely detectable in MDA-MB-453, MDA-MB-468 and MDA-MB-134, and significantly decreased in MDA-MB-231, MDA-MB-436 and MDA-MB-157. In the case of BT-549 cell line, 4.6kb band displayed more than 5-fold decrease but 3kb band showed an approximately 3-fold increase. (Fig. 6A)
Fig 5
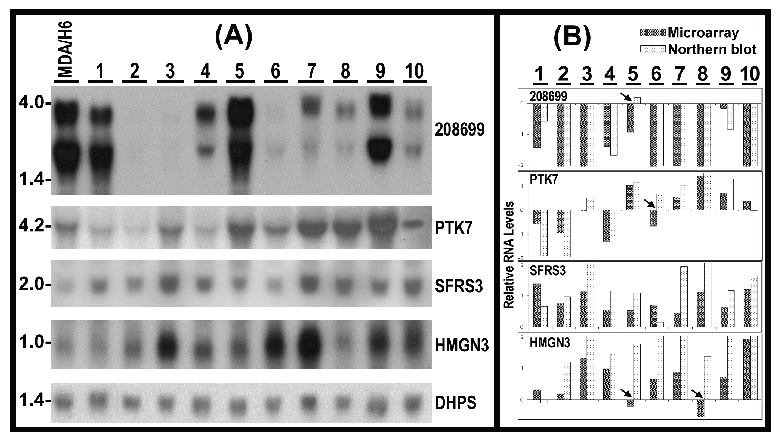
(A) Northern hybridization blots show the RNA levels of 4 genes in 10 breast cancer cell lines (1-10) in comparison to MDA/H6. 20 micrograms of RNA were loaded in each lane. 208699: KIAA1949; PTK7: protein tyrosine kinase 7; SFRS3: splicing factor arginine/serine-rich 3; HMGN3: high mobility group nucleosomal binding domain 3; DHPS: deoxyhypusine synthase as a control for RNA loading and transfer. (B) Bar graph of relative RNA levels detected by microarray and Northern experiments. Both sets of data were first normalized to DHPS and MDA/H6, and then compared as the bar graph. The arrowheads indicate 4 differences. Thus, 90% (40 comparisons) expression changes were consistent between these two independent experiments. 1, MDA-MB-231; 2, ZR75-1; 3, BT474; 4, MDA-MB-436; 5, BT549; 6, MDA-MB-453; 7, MDA-MB-468; 8, BT-20; 9, MDA-MB-157; and 10, MDA-MB-134.
Fig 6
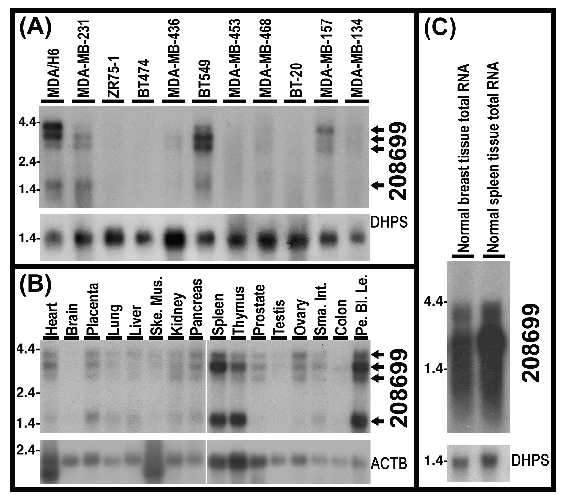
Northern hybridization blots show 4 poly(A)-RNA bands (4.6-, 4-, 3- and 1.5-kb) and levels of KIAA1949 detected by 208699 probes in 10 breast cancer cell lines (1-10) in comparison to MDA/H6. (A) Northern blots of poly(A)-RNA for 11 breast cancer cell lines with 20 micrograms of poly(A)-RNA per lane. (B) Northern blots of the Clontech Northern membrane with poly(A)-RNA from human normal tissues, Ske Mus, skeletal muscle; Sma Int, small intestine; Pe Bl Le, peripheral blood leukocyte. (C) Northern blots of 20 micrograms of total RNA. DHPS: deoxyhypusine synthase and ACTB: beta actin, as controls for RNA loading and transfer.
To determine whether these 4 transcripts are also present in normal tissues, we conducted Northern analysis using the Clontech Northern membrane with multiple normal tissue poly(A)-RNA. The results confirmed the presence of these four transcripts in 13 normal tissues including heart, placenta, lung, liver, skeletal muscle, kidney, pancreas, spleen, thymus, prostate, ovary, small intestine and peripheral blood leukocyte. These transcripts were very faint in testis and colon mucosal lining tissues and were not visible in brain tissue. (Fig. 6B) In addition, our Northern hybridization with total RNA of human normal mammary gland and spleen tissues revealed high-level expression of the KIAA1949 bands (or smear) in the normal breast tissue. (Fig. 6C)
Discussion
Breast cancer is extensively heterogeneous malignant disease. Identification of expression profiles of multiple cancer samples may reveal gene expression changes that are specific to individual samples and common to most, if not all, samples studied. The common expression patterns might represent a common “passage” through which the cells evolve from one stage to another. Although the high throughput technology DNA microarray is very useful to reveal genome-wide gene expression profiles, customized microarrays with a focused group of genes facilitate a hypothesis-driven study and simplify microarray data analysis as exemplified by the previous study (26). In this study, we combined genome-wide gene chips with customized microarrays to identify chromosome 6-encoded differentially expressed genes in 10 breast cancer cell lines and 5 tumor tissues in comparison to the chromosome 6-medidated suppressed non-tumorigenic and non-metastatic breast cancer cell line MDA/H6. Specifically, after screening 25,985 cDNA probes using genomic microarrays, we identified 651 genes with more than 800 signal intensities and more than 2-fold changes in expression between the parental tumorigenic and metastatic breast cancer cell line MDA-MB-231 and the chromosome 6-mediated suppressed non-tumorigenic and non-metastatic derivative cell line MDA/H6. Then, we designed and fabricated 651 genes with 117 various controls in double sets on the individual glass slides. Using the customized DNA microarrays, we identified 200 frequently dysregulated in breast cancer cell lines (n=10) and tumor tissues (n=5) in comparison to MDA/H6. Upon mapping these genes to chromosome band regions, we identified 25 differentially expressed genes that are known to be encoded by chromosome 6, of which 4 genes (KIAA1949, TUBB, NQO2 and SF3B5) were downregulated in 50%-100% (n=15) of breast cancer samples studied. The KIAA1949 gene with 86.7% downregulation in all 15 breast cancers studied is located at the chromosome 6 band region with the high frequency of LOH. Therefore, we further analyzed the transcripts and expression levels of KIAA1949 in 11 breast cancer cell lines and 17 human normal tissues.
Microarray detection of gene expression can be affected by many factors including cell culture conditions, RNA purification, cDNA labeling methods and quality of microarrays. In this study, we manufactured high quality microarrays to reduce variance that could otherwise be introduced by different gene chips. By testing gene expression between MDA-MB-231 and MDA/H6 cells in triplicate microarray experiments with fluorescent dye sways, we demonstrated the strong positive linear relations and high values of Pearson coefficient of correlation between the customized microarrays, and therefore, the consistency and reproducibility of the customized gene chips and microarray experiments.
Our combined genome-wide and focused cDNA microarray approaches led to the identification of 25 chromosome 6-encoded genes that were frequently dysregulated in 10 breast cancer cell lines and 5 breast cancer tumor tissues in comparison to the chromosome 6-mediated suppressed non-tumorigenic and non-metastatic cell line MDA/H6. Interestingly, only KIAA1949 was downregulated frequently in these breast cancers and is known to be encoded at 6p21.33, a chromosome 6 band region with the PUBMED documented high frequency in the loss of heterozygosity. Other genes downregulated in MDA-MB-231 include CAP2, ZNF184, RPL10A, PTK7 and PDCD2; however, they were not frequently downregulated in other breast cancer cell lines and tumor tissues. NQO2, TUBB and SF3B5 were downregulated relatively frequently in these breast cancers but they were not in MDA-MD-231, the parental cell line of MDA/H6. All other genes were significantly upregulated in these breast cancers. Therefore, KIAA1949 is the only strong candidate as a novel breast cancer tumor suppressor gene.
KIAA1949 was originally cloned from a fetal brain cDNA library by Nagase et al. who also reported its expression in multiple normal human tissues including spleen, lung, liver, ovary, and other adult and fetal tissues (30). Recently, Kao et al. cloned KIAA1949 using yeast 2-hybrid screening of a heart cDNA library and named it as phostensin based on its protein function (31). Kao and colleagues also detected 1.5- and 4.2-kb transcripts in multiple tissues except brain, prostate and colon. In our study, the RNA expression was detected in the prostate and colon but not in the brain. In addition, we showed a high level of RNA in normal human breast tissue. Moreover, we detected a total of four mRNA species (4.6-, 4-, 3- and 1.5-kb bands) in 14 of 17 normal tissues and 5 of 11 breast cancer cell lines studied. A significance of the presence of 4 different transcripts for the KIAA1949 genes in cells remains to be determined.
Kao et al named the KIAA1949-encoded 26-kDa protein as phostensin based on their discovery of it as a regulatory subunit that targets protein phosphatase-1 to F-actin cytoskeleton (31). Although Nagase et al originally predicted an open reading frame with 662 amino acid residues for the KIAA1949 protein (30), Kao and his colleagues could detect only a 26-kDa protein (31). This raises the question as to whether the 4 transcripts we detected in tissues and cells may play a regulatory role for protein synthesis. Recently, Lai et al characterized the biochemical functions of phostensin and showed that phostensin decreases the elongation and depolymerization rates of acting filament pointed ends. Their results suggested that phostensin is an actin filament pointed end-capping protein that is capable of modulating actin dynamics (32), whether this activity has effects on cancer cell invasion and metastasis is an interesting hypothesis under investigation.
Our microarray analysis revealed 90% downregulation of KIAA1949 in breast cancer cell lines (n=10) and 80% downregulation in the clinically-derived breast cancer tumor tissues (n=5). Our Northern analysis of the KIAA1949 poly(A)-RNA demonstrated 100% downregulation in these 10 cell lines including 30% undetectable, 30% barely detectable and 40% significant decrease. Taken all data together, our results strongly suggest that KIAA1949 is a novel candidate breast cancer suppressor gene. In this regard, whether phstensin acitivities in modulating actin dynamics play any role in cancer cell invasion and metastasis is an interesting hypothesis that merits investigation. Our tumorigenicity test of breast cancer cell lines with and without transfection and overexpression of phostensin is in progress.
Acknowledgements
The authors greatly appreciate Dr. Massimo Negrini for generously providing us with the MDA/H6 cell line. This work was supported in part by the United States Army Medical Research and Materiel Command award DAMD17-97-1-7236 and The V Foundation grant to YAS.
Conflict of Interest
The authors have declared that no conflict of interest exists.
References
1. Piao Z, Lee KS, Kim H, Perucho M, Malkhosyan S. Identification of novel deletion regions on chromosome arms 2q and 6p in breast carcinomas by amplotype analysis. Genes Chromosomes Cancer. 2001Feb;30(2):113-22
2. Fujii H, Zhou W, Gabrielson E. Detection of frequent allelic loss of 6q23-q25.2 in microdissected human breast cancer tissues. Genes Chromosomes Cancer. 1996May;16(1):35-9
3. Noviello C, Courjal F, Theillet C. Loss of heterozygosity on the long arm of chromosome 6 in breast cancer: possibly four regions of deletion. Clin Cancer Res. 1996Sep;2(9):1601-6
4. Sheng ZM, Marchetti A, Buttitta F, Champeme MH, Campani D, Bistocchi M. et al. Multiple regions of chromosome 6q affected by loss of heterozygosity in primary human breast carcinomas. Br J Cancer. 1996Jan;73(2):144-7
5. Rodriguez C, Causse A, Ursule E, Theillet C. At least five regions of imbalance on 6q in breast tumors, combining losses and gains. Genes Chromosomes Cancer. 2000Jan;27(1):76-84
6. Monti L, Cinquetti R, Guffanti A, Nicassio F, Cremona M, Lavorgna G. et al. In silico prediction and experimental validation of natural antisense transcripts in two cancer-associated regions of human chromosome 6. Int J Oncol. 2009Apr;34(4):1099-108
7. Rosa-Rosa JM, Pita G, Urioste M, Llort G, Brunet J, Lazaro C. et al. Genome-wide linkage scan reveals three putative breast-cancer-susceptibility loci. Am J Hum Genet. 2009Feb;84(2):115-22
8. Negrini M, Sabbioni S, Possati L, Rattan S, Corallini A, Barbanti-Brodano G. et al. Suppression of tumorigenicity of breast cancer cells by microcell- mediated chromosome transfer: studies on chromosomes 6 and 11. Cancer Res. 1994Mar1;54(5):1331-6
9. Theile M, Seitz S, Arnold W, Jandrig B, Frege R, Schlag PM. et al. A defined chromosome 6q fragment (at D6S310) harbors a putative tumor suppressor gene for breast cancer. Oncogene. 1996Aug15;13(4):677-85
10. Trent JM, Stanbridge EJ, McBride HL, Meese EU, Casey G, Araujo DE. et al. Tumorigenicity in human melanoma cell lines controlled by introduction of human chromosome 6. Science. 1990Feb2;247(4942):568-71
11. Su YA, Bittner ML, Chen Y, Tao L, Jiang Y, Zhang Y. et al. Identification of tumor-suppressor genes using human melanoma cell lines UACC903, UACC903(+6), and SRS3 by comparison of expression profiles. Mol Carcinog. 2000Jun;28(2):119-27
12. Qin H, Shao Q, Curtis H, Galipeau J, Belliveau DJ, Wang T. et al. Retroviral delivery of connexin genes to human breast tumor cells inhibits in vivo tumor growth by a mechanism that is independent of significant gap junctional intercellular communication. J Biol Chem. 2002Aug9;277(32):29132-8
13. Piras G, El KA, Kozlov S, Escalante-Alcalde D, Hernandez L, Copeland NG. et al. Zac1 (Lot1), a potential tumor suppressor gene, and the gene for epsilon-sarcoglycan are maternally imprinted genes: identification by a subtractive screen of novel uniparental fibroblast lines. Mol Cell Biol. 2000May;20(9):3308-15
14. Cesari R, Martin ES, Calin GA, Pentimalli F, Bichi R, McAdams H. et al. Parkin, a gene implicated in autosomal recessive juvenile parkinsonism, is a candidate tumor suppressor gene on chromosome 6q25-q27. Proc Natl Acad Sci U S A. 2003May13;100(10):5956-61
15. Zeller C, Hinzmann B, Seitz S, Prokoph H, Burkhard-Goettges E, Fischer J. et al. SASH1: a candidate tumor suppressor gene on chromosome 6q24.3 is downregulated in breast cancer. Oncogene. 2003May15;22(19):2972-83
16. Schena M, Shalon D, Davis RW, Brown PO. Quantitative monitoring of gene expression patterns with a complementary DNA microarray [see comments]. Science. 1995Oct20;270(5235):467-70
17. Hedenfalk I, Duggan D, Chen Y, Radmacher M, Bittner M, Simon R. et al. Gene-expression profiles in hereditary breast cancer. N Engl J Med. 2001Feb22;344(8):539-48
18. Sorlie T, Perou CM, Tibshirani R, Aas T, Geisler S, Johnsen H. et al. Gene expression patterns of breast carcinomas distinguish tumor subclasses with clinical implications. Proc Natl Acad Sci U S A. 2001Sep11;98(19):10869-74
19. Schwirzke M, Evtimova V, Burtscher H, Jarsch M, Tarin D, Weidle UH. Identification of metastasis-associated genes by transcriptional profiling of a pair of metastatic versus non-metastatic human mammary carcinoma cell lines. Anticancer Res. 2001May;21(3B):1771-6
20. van de Vijver MJ, He YD, van't Veer LJ, Dai H, Hart AA, Voskuil DW. et al. A gene-expression signature as a predictor of survival in breast cancer. N Engl J Med. 2002Dec19;347(25):1999-2009
21. van't Veer LJ, Dai H, van de Vijver MJ, He YD, Hart AA, Mao M. et al. Gene expression profiling predicts clinical outcome of breast cancer. Nature. 2002Jan31;415(6871):530-6
22. Yang GP, Ross DT, Kuang WW, Brown PO, Weigel RJ. Combining SSH and cDNA microarrays for rapid identification of differentially expressed genes. Nucleic Acids Res. 1999Mar15;27(6):1517-23
23. Beck MT, Holle L, Chen WY. Combination of PCR subtraction and cDNA microarray for differential gene expression profiling. Biotechniques. 2001Oct;31(4):782-4
24. Su YA, Trent JM. Isolation of tumor suppressor genes in melanoma by cDNA microarray. In: (ed.) Nickoloff BJ. Methods in Molecular Medicine. Totowa, NJ: The Human Press Inc. 2001:15-29
25. Chen Y, Dougherty ER, Bittner ML. Ratio-based quantitative analysis of cDNA microarray images. Biomed Optics. 1997;2:364-74
26. Bai X, Wu J, Zhang Q, Alesci S, Manoli I, Blackman MR. et al. Third-generation human mitochondria-focused cDNA microarray and its bioinformatic tools for analysis of gene expression. Biotechniques. 2007Mar;42(3):365-75
27. Bolstad BM, Irizarry RA, Astrand M, Speed TP. A comparison of normalization methods for high density oligonucleotide array data based on variance and bias. Bioinformatics. 2003Jan22;19(2):185-93
28. Eisen MB, Spellman PT, Brown PO, Botstein D. Cluster analysis and display of genome-wide expression patterns. Proc Natl Acad Sci U S A. 1998Dec8;95(25):14863-8
29. Selden RF. Analysis of RNA by Northern Hybridization. In: (ed.) Ausubel FM, Brent R, Kingston RE, Moore DD, Seidman JG, Smith JA. et al. Current Protocols in Molecular Biology. New York: John Wiley & Sons, Inc. 1987
30. Nagase T, Kikuno R, Ohara O. Prediction of the coding sequences of unidentified human genes. XXII. The complete sequences of 50 new cDNA clones which code for large proteins. DNA Res. 2001;8(6):319-27
31. Kao SC, Chen CY, Wang SL, Yang JJ, Hung WC, Chen YC. et al. Identification of phostensin, a PP1 F-actin cytoskeleton targeting subunit. Biochem Biophys Res Commun. 2007May11;356(3):594-8
32. Lai NS, Wang TF, Wang SL, Chen CY, Yen JY, Huang HL. et al. Phostensin caps to the pointed end of actin filaments and modulates actin dynamics. Biochem Biophys Res Commun. 2009Oct2;387(4):676-81
Author contact
![]() Corresponding author: Yan A. Su, MD, PhD, GenProMarkers Inc., 9700 Great Seneca Highway, Suite 182, Rockville, Maryland 20850. Phone: (301) 326-6523; FAX: (240) 453-6208; Email:gpmyascom
Corresponding author: Yan A. Su, MD, PhD, GenProMarkers Inc., 9700 Great Seneca Highway, Suite 182, Rockville, Maryland 20850. Phone: (301) 326-6523; FAX: (240) 453-6208; Email:gpmyascom
Citation styles
APA
Su, Y.A., Yang, J., Tao, L., Nguyen, H., He, P. (2010). Undetectable and Decreased Expression of KIAA1949 (Phostensin) Encoded on Chromosome 6p21.33 in Human Breast Cancers Revealed by Transcriptome Analysis. Journal of Cancer, 1, 38-50. https://doi.org/10.7150/jca.1.38.
ACS
Su, Y.A.; Yang, J.; Tao, L.; Nguyen, H.; He, P. Undetectable and Decreased Expression of KIAA1949 (Phostensin) Encoded on Chromosome 6p21.33 in Human Breast Cancers Revealed by Transcriptome Analysis. J. Cancer 2010, 1, 38-50. DOI: 10.7150/jca.1.38.
NLM
Su YA, Yang J, Tao L, Nguyen H, He P. Undetectable and Decreased Expression of KIAA1949 (Phostensin) Encoded on Chromosome 6p21.33 in Human Breast Cancers Revealed by Transcriptome Analysis. J Cancer 2010; 1:38-50. doi:10.7150/jca.1.38. https://www.jcancer.org/v01p0038.htm
CSE
Su YA, Yang J, Tao L, Nguyen H, He P. 2010. Undetectable and Decreased Expression of KIAA1949 (Phostensin) Encoded on Chromosome 6p21.33 in Human Breast Cancers Revealed by Transcriptome Analysis. J Cancer. 1:38-50.
This is an open access article distributed under the terms of the Creative Commons Attribution (CC BY-NC) License. See http://ivyspring.com/terms for full terms and conditions.